How Developers Track and Visualize Volatility of Commodity Prices in Real Time
By
Ejaz Ahmed9 Feb 2026 • 11 min read
Suppose you are creating a fintech dashboard for a logistics company. Geopolitical tension leads to a sudden increase in crude oil prices, and your users have to protect their risks as soon as possible. Your stale data makes your users lose money.
Following the commodity prices is a game of high stakes. Developers have to go beyond price feeds to capture the velocity of change. In this blog, the author discusses how to develop systems to deal with real-time price volatility using the emerging APIs and statistical models.
We shall discuss the reason for the volatility of commodity prices. The mathematics behind the standard deviation of the prices and some Python applications will also be discussed.
At the end, you would be aware of how to convert raw JSON data into actionable risk insights. Let us explore the commodity market uncertainty. Then we shall know how to handle it with code.
Understanding The Volatility Of Commodity Prices
What exactly is commodity price volatility? Simply stated, it is the extent to which the prices move during a given period of time. High volatility implies that price swings analysis reflects enormous gaps between highs and lows.
Why Does Volatility Matter?
Volatility is a two-edged sword for investors. It brings risk as well as investment opportunities. Inflation is normally a result of high commodity prices, and this necessitates the policy makers to change the monetary policy.
In the case of firms dealing with agriculture or industrial metals, unexpected spikes bring cost. They affect purchasing practices and the volatility of commodity prices. Precious metal markets explode when there is economic uncertainty related. People use gold as a store of value.
Types of Volatility
There are two kinds of data normally followed by the developers:
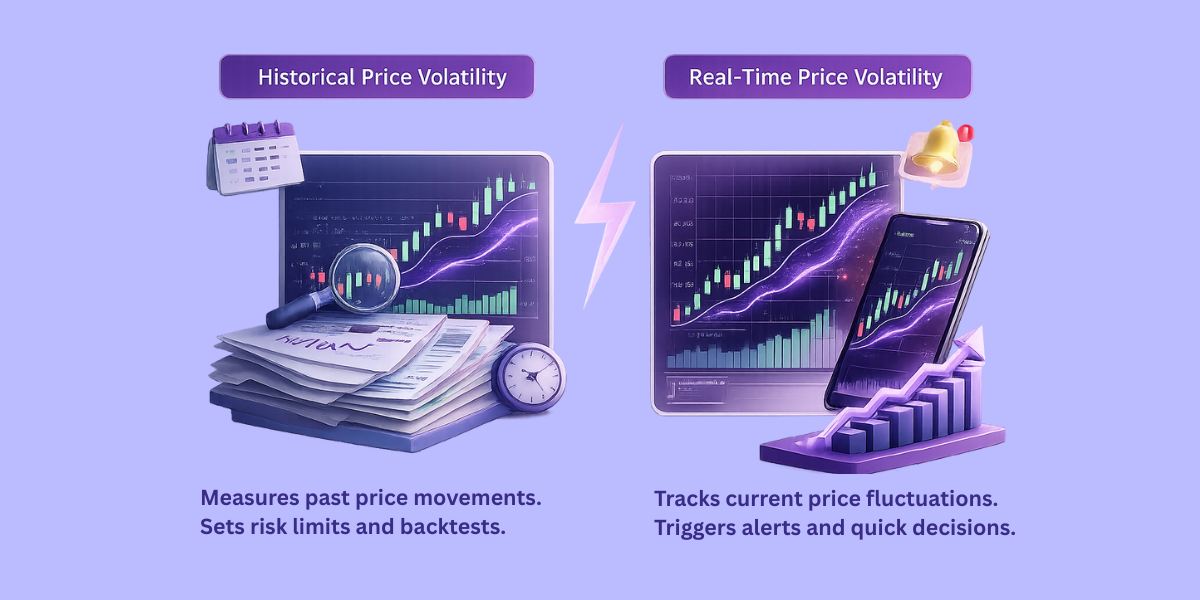
Historical Price Volatility
Historical price volatility measures the extent to which the price moved in the past. You compute it based on historical time series data, such as daily or hourly closes. It makes you know about normal ranges, seasonality, and the past shock periods. You train models, set risk limits, and use them in backtesting.
Real-Time Price Volatility
Real-time price volatility indicators are used to monitor the movement of prices in real time, including the volatility of commodity prices. You calculate it using short-rolling windows or live updates.
It assists you in raising signals whenever the market breaks a limit. You apply it in monitoring, timing hedges, and making decisions faster.
Key Factors Driving Commodity Price Fluctuations
The volatility of commodity prices is dependent on many factors. Knowing these assists you in creating greater forecasting tools.
- Supply and Demand: The invasion of Ukraine by Russia is one of the best examples of the impacts of a supply shock on natural gas prices.
- Macroeconomic Trends: The alteration of interest rates and exchange rates has a direct effect on the process of recovery from the global financial crisis.
- Storage and Logistics: Low storage of natural gas may cause the occurrence of high levels of price spikes during winter.
- Conjecture: Futures markets are usually driven by money in the futures markets on the basis of financial uncertainty.
Commodity Category | Key Driver | Volatility Level |
Energy Prices | Geopolitics & Storage | Very High |
Precious Metals | Economic Performance | Moderate/High |
Industrial Metals | Infrastructure Demand | Moderate |
Helpful Resource: Detecting Commodity Price Fluctuations For Smarter Trading Decisions
Tracking Volatility Using A Volatility Tracking API
In order to create a risk management in commodities tool, you should have a trusted volatility tracking API. It should capture the volatility of commodity prices. With CommodityPriceAPI, you can access real-time price volatility data of more than 130 commodities.
Step 1: Authentication and Setup
The first step is to authenticate and set up. To getthe latest rates, you require an API key. The API delivers information in a clean JSON format, which is ideal for market participants who require liquidity and speed.
Step 2: Python Code Example
This is how one can use Python to find the standard deviation of prices, which is a typical indicator of volatility.
import os
import requests
import numpy as np

# =========================
# Configuration
# =========================
API_KEY = os.getenv("COMMODITYPRICEAPI_KEY", "YOUR_API_KEY")  # set env var in production
BASE_URL = "https://api.commoditypriceapi.com/v2/timeseries"  # v2 base URL documented :contentReference[oaicite:2]{index=2}
SYMBOL = "WTIOIL-FUT"  # supported symbol list includes WTIOIL-FUT :contentReference[oaicite:3]{index=3}

def extract_close_price(day_payload, symbol: str) -> float:
    """
    Supports both:
      - day_payload[symbol] == number
      - day_payload[symbol] == {"close": number, ...}
    """
    if symbol not in day_payload:
        raise KeyError(f"Symbol '{symbol}' not found in rates for this date.")

    value = day_payload[symbol]

    # Case A: numeric
    if isinstance(value, (int, float)):
        return float(value)

    # Case B: dict with close
    if isinstance(value, dict) and "close" in value:
        return float(value["close"])

    raise ValueError(f"Unrecognized rate format for '{symbol}': {type(value)}")

def get_annualized_volatility(symbol: str, start_date: str, end_date: str, trading_days: int = 252) -> float:
    """
    Annualized volatility using log returns:
      vol = std(diff(log(prices))) * sqrt(trading_days)
    """
    if API_KEY == "YOUR_API_KEY":
        raise ValueError("Replace YOUR_API_KEY or set COMMODITYPRICEAPI_KEY environment variable.")

    params = {
        "apiKey": API_KEY,         # API key via query param is supported :contentReference[oaicite:4]{index=4}
        "symbols": symbol,         # required :contentReference[oaicite:5]{index=5}
        "startDate": start_date,   # required :contentReference[oaicite:6]{index=6}
        "endDate": end_date        # required :contentReference[oaicite:7]{index=7}
    }

    resp = requests.get(BASE_URL, params=params, timeout=30)
    resp.raise_for_status()
    data = resp.json()

    if not data.get("success", False):
        # API returns structured errors (code/message/etc.) :contentReference[oaicite:8]{index=8}
        msg = data.get("message") or data.get("error") or "Unknown API error"
        raise RuntimeError(f"API request failed: {msg}")

    rates = data.get("rates", {})
    if not rates:
        raise RuntimeError("No rates returned for the given date range.")

    # Sort by date key to ensure correct time order
    dates_sorted = sorted(rates.keys())
    prices = []
    for d in dates_sorted:
        day_payload = rates[d]
        prices.append(extract_close_price(day_payload, symbol))

    if len(prices) < 2:
        raise RuntimeError("Not enough price points to compute volatility (need at least 2).")

    prices = np.array(prices, dtype=float)

    # Log returns
    log_returns = np.diff(np.log(prices))

    # Annualized volatility
    vol = float(np.std(log_returns, ddof=1) * np.sqrt(trading_days))  # ddof=1 = sample std
    return vol

if __name__ == "__main__":
    oil_vol = get_annualized_volatility(SYMBOL, "2025-01-01", "2025-01-31")
    print(f"Annualized Volatility for {SYMBOL}: {oil_vol:.2%}")
Here is the output
Annualized Volatility for WTIOIL-FUT: 27.84%Helpful Resource: Predicting Commodity Price Trends Using Historical Data And Fluctuations
Statistical Volatility Models For Developers
In addition to basic math, the economic theory would recommend more advanced statistical volatility models. They aid in predicting how the price volatility varies with time. They are effective in switching between calm periods and shock periods in markets.
They are used by many teams to establish alert thresholds and risk limits. They also assist in making comparisons of the volatility of commodity prices such as oil, copper, and wheat.
The GARCH Model
The GARCH model is a popular finance model. It assumes that high volatility clumps together. That is, bad times tend to succeed bad times.
It uses the historical returns and past volatility of commodity prices to come up with the next volatility estimate. This enables it to be applied to rolling forecasts and risk bands. GARCH is commonly employed by developers when the simple rolling standard deviation is too slow.
The Volatility Index For Commodities
A commodities volatility index, similar to a stock VIX, follows the market expectations. The index will increase with an increase in uncertainty. That usually occurs with export bans, supply shocks, or cutbacks in crude oil production.
It has the capacity to be a mood indicator in the market. You may utilize it to determine what your price model is indicating. It also assists in explaining risk to non-technical stakeholders.
Visualizing Price Swings Analysis
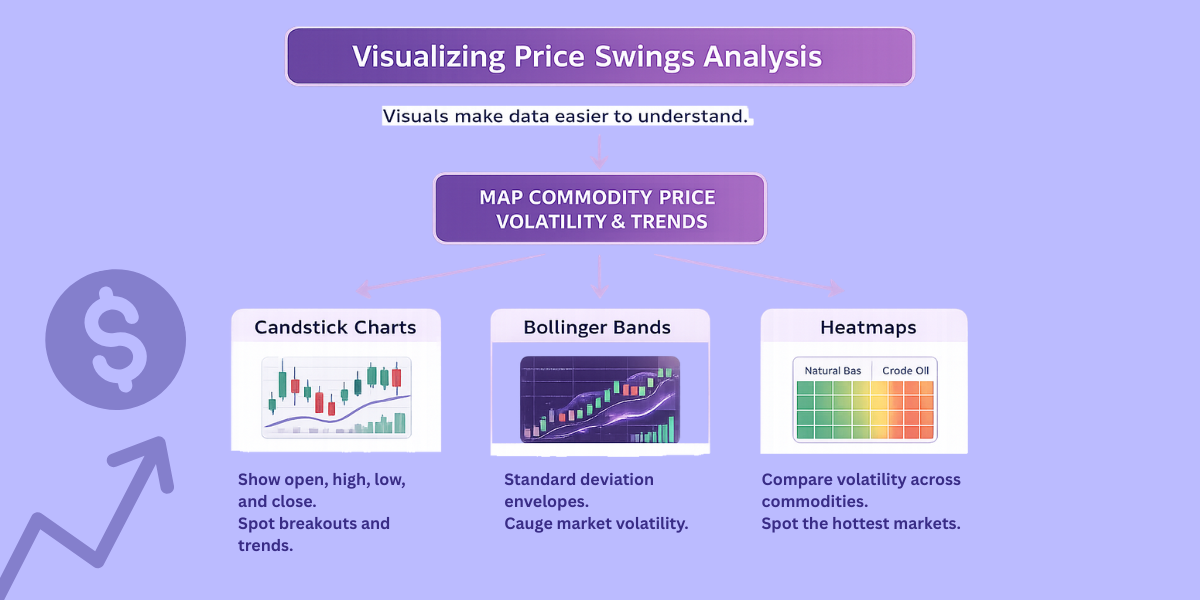
Visuals make people more responsive to data. The volatility of commodity prices and the trends of copper, heating oil, or gold are frequently mapped by Plotly or D3.js developers.
Spike, gaps, and regime changes are also easier to see using clear charts. They assist you in describing risk at a glance with more predictive power. They are also helpful in making alerts and dashboards.
Candlestick Charts
Represent the open, high, low, and close (OHLC). The intraday swings become visible to them. Breakouts, reversals, and trend strength are easily identified. Even when tracking the volatility of commodity prices. They are excellent in tracking futures and spot prices.
Bollinger Bands
This is based on the standard deviation of prices, which are used to develop envelopes around a moving average. The broader the bands, the more volatility of commodity prices. Narrow bands tend to indicate a silent market preceding a large shift. They assist in setting simple alert thresholds.
Heatmaps
Compare the volatility of commodity prices, such as natural gas vs. crude oil. They demonstrate the hottest markets at the moment. They assist teams in focusing on monitoring and hedging. They are also effective at the sector level views.
Helpful Resource: Integrate Commodity Prices API into Your App in Minutes
Impact of Volatility On The Economy
The adverse impacts of price volatility are massive. The volatility of commodity prices can hit households fast. Consumer spending declines when energy prices or agricultural expenditures increase too rapidly. This may influence the economic performance of a country in general.
But there are also positive effects. The volatility of commodity prices can attract traders. Volatility is high, which brings investment and liquidity in future prices. It enables investors to discover value in the market that other investors would avoid during uncertainty in financial markets.
Recent reports have indicated that time variation in volatility is a major factor in the determination of interest rates. To exporters, volatility alters the costs of hedging. It also affects the timing of getting payments. It may increase the bid-ask spreads in thin markets. Then it can narrow when liquidity comes back.
- Rapid changes in prices may increase the inflation pressure.
- The uncertainty makes budgeting more difficult for businesses and governments.
- When traders attempt to take advantage of short-term opportunities, liquidity tends to go upward.
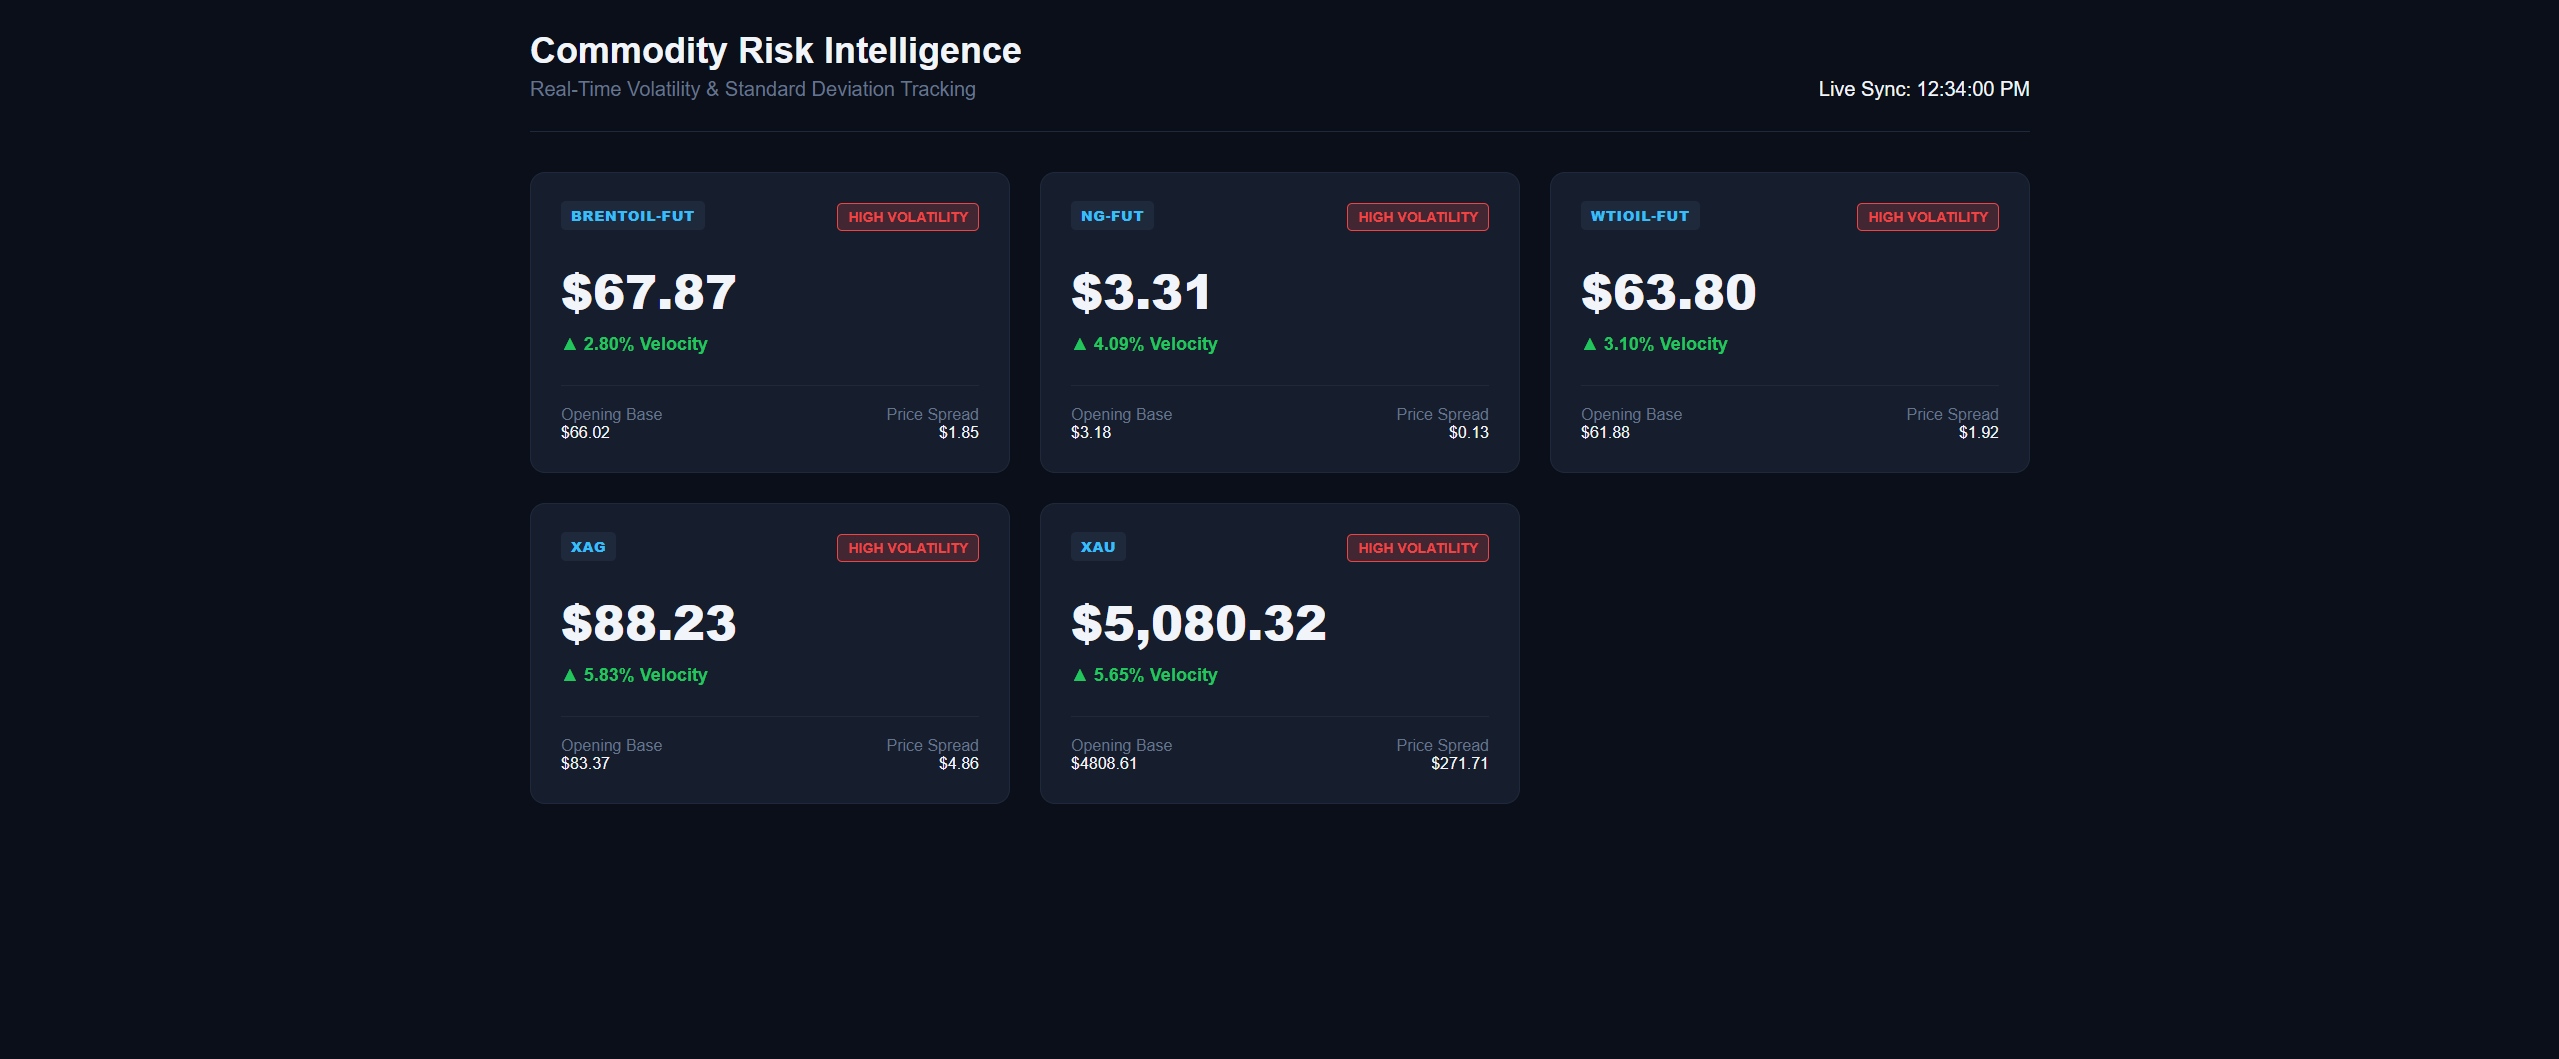
Building a Commodity Markets Tracker to Track the Volatility of Commodity Prices
Create a new folder using the command prompt and create an index.html file. Next, paste the code below into that file after adding your own API key. Please note that you can also access the code example through our GitHub directory:
<!DOCTYPE html>
<html lang="en">
<head>
    <meta charset="UTF-8">
    <meta name="viewport" content="width=device-width, initial-scale=1.0">
    <title>Risk Management: Volatility Terminal</title>
    <style>
        :root {
            --bg: #0b0f1a;
            --card-bg: #161e2d;
            --text: #f1f5f9;
            --accent: #38bdf8;
            --up: #22c55e;
            --down: #ef4444;
            --border: #1e293b;
            --warning: #f59e0b;
        }
        body {
            font-family: 'Inter', -apple-system, sans-serif;
            background: var(--bg);
            color: var(--text);
            margin: 0; padding: 2rem;
        }
        .container { max-width: 1200px; margin: 0 auto; }
        .header {
            border-bottom: 1px solid var(--border);
            padding-bottom: 1.5rem; margin-bottom: 2rem;
            display: flex; justify-content: space-between; align-items: flex-end;
        }
        .grid {
            display: grid;
            grid-template-columns: repeat(auto-fit, minmax(300px, 1fr));
            gap: 1.5rem;
        }
        .card {
            background: var(--card-bg);
            padding: 1.5rem;
            border-radius: 12px;
            border: 1px solid var(--border);
            transition: transform 0.2s;
        }
        .card:hover { transform: translateY(-4px); border-color: var(--accent); }

        .badge {
            background: #1e293b; color: var(--accent);
            padding: 4px 8px; border-radius: 4px;
            font-size: 0.7rem; font-weight: 800; letter-spacing: 0.05em;
        }
        .risk-tag {
            float: right; font-size: 0.7rem; padding: 4px 8px; border-radius: 4px; font-weight: bold;
        }
        .risk-high { background: rgba(239, 68, 68, 0.2); color: var(--down); border: 1px solid var(--down); }
        .risk-low { background: rgba(34, 197, 94, 0.2); color: var(--up); border: 1px solid var(--up); }

        .price-area { margin: 1.5rem 0; }
        .price-val { font-size: 2.4rem; font-weight: 800; display: block; }
        .vol-stat { font-size: 0.9rem; margin-top: 0.5rem; font-weight: 600; }

        .footer-stats {
            display: grid; grid-template-columns: 1fr 1fr;
            margin-top: 1rem; padding-top: 1rem;
            border-top: 1px solid var(--border);
            font-size: 0.8rem; color: #94a3b8;
        }
        .loading { color: var(--accent); font-weight: bold; }
    </style>
</head>
<body>

<div class="container">
    <div class="header">
        <div>
            <h1 style="margin:0; font-size: 1.8rem;">Commodity Risk Intelligence</h1>
            <p style="color: #64748b; margin: 5px 0 0 0;">Real-Time Volatility & Standard Deviation Tracking</p>
        </div>
        <div id="sync-status" class="loading">Initializing Engine...</div>
    </div>

    <div class="grid" id="risk-grid">
        </div>
</div>

<script>
    const API_KEY = "ADD-YOUR-OWN-API-KEY";
    const BASE_URL = "https://api.commoditypriceapi.com/v2";

    // Symbols matching the article's supply shock/logistics focus
    const SYMBOLS = ["WTIOIL-FUT", "BRENTOIL-FUT", "XAU", "XAG", "NG-FUT"];

    async function fetchVolatilityData() {
        const status = document.getElementById('sync-status');

        // Handling the "Historical Data Gap" (Yesterday vs Day Before)
        const end = new Date();
        end.setDate(end.getDate() - 1);
        const start = new Date();
        start.setDate(start.getDate() - 2);

        const startDate = start.toISOString().split('T')[0];
        const endDate = end.toISOString().split('T')[0];

        // API Endpoint for Fluctuation (Standard Deviation equivalent provided by API)
        const url = `${BASE_URL}/rates/fluctuation?apiKey=${API_KEY}&symbols=${SYMBOLS.join(',')}&startDate=${startDate}&endDate=${endDate}`;

        try {
            const response = await fetch(url);
            const data = await response.json();

            if (!data.success) throw new Error(data.message || "API Error");

            renderRiskCards(data.rates);
            status.textContent = `Live Sync: ${new Date().toLocaleTimeString()}`;
            status.classList.remove('loading');
        } catch (err) {
            status.textContent = "Sync Error - Check API Key";
            console.error(err);
        }
    }

    function renderRiskCards(rates) {
        const grid = document.getElementById('risk-grid');
        grid.innerHTML = '';

        Object.entries(rates).forEach(([symbol, info]) => {
            // Logic: High Volatility if change percent > 2% (The "Uncertainty" signal)
            const isHighRisk = Math.abs(info.changePercent) > 2.0;
            const trendColor = info.change >= 0 ? 'var(--up)' : 'var(--down)';

            const card = document.createElement('div');
            card.className = 'card';
            card.innerHTML = `
                <span class="badge">${symbol}</span>
                <span class="risk-tag ${isHighRisk ? 'risk-high' : 'risk-low'}">
                    ${isHighRisk ? 'HIGH VOLATILITY' : 'STABLE'}
                </span>

                <div class="price-area">
                    <span class="price-val">$${info.endRate.toLocaleString(undefined, {minimumFractionDigits: 2})}</span>
                    <div class="vol-stat" style="color: ${trendColor}">
                        ${info.change >= 0 ? '▲' : '▼'} ${Math.abs(info.changePercent).toFixed(2)}% Velocity
                    </div>
                </div>

                <div class="footer-stats">
                    <div>
                        <div style="color:#64748b">Opening Base</div>
                        <div style="color:#f1f5f9">$${info.startRate.toFixed(2)}</div>
                    </div>
                    <div style="text-align: right">
                        <div style="color:#64748b">Price Spread</div>
                        <div style="color:#f1f5f9">$${Math.abs(info.change).toFixed(2)}</div>
                    </div>
                </div>
            `;
            grid.appendChild(card);
        });
    }

    // Start Tracker
    fetchVolatilityData();
    // Auto-refresh every 5 minutes as promised in "Real-Time Tracking"
    setInterval(fetchVolatilityData, 300000);
</script>

</body>
</html>
Here is the output:
TL;DR: Quick Summary
- Volatility of commodity prices is used to determine the strength.
- CommodityPriceAPI is a source of information to track in real time.
- Risk management requires the use of standard deviation and GARCH models.
- Uncertainty is caused by geopolitics, such as Russia's invasion, and macroeconomic factors.
Conclusion
Modern developers must know how to handle the volatility of commodity prices. With a powerful volatility tracking API and a statistical volatility model, you create something more than a chart. You construct a barrier against uncertainty in the commodity market.
Be it the markets of precious metals or crude oil, the most important thing is real time accuracy. Valid data minimises the adverse impact of price swings analysis. It also assists policymakers and firms to operate in a confident manner.
This configuration provides you with alerts, risk bands, and cleaner trend signals. It enhances more effective hedging and intelligent buying timing. With time, your models get better since they get to know the live moves and the stable history.
FAQs
What Is The Best Way To Measure Commodity Price Volatility?
The most frequently used indicator is the standard deviation of prices within a time interval. To have more advanced requirements, developers employ a commodity volatility index or GARCH.
How Does Economic Uncertainty Affect Commodity Prices?
A flight to quality is frequently initiated by economic insecurity. This could drive the price of gold higher, and the price of an industrial metal such as copper might fall as more metal is expected to be produced.
Can I Track Historical Price Volatility?
Yes. By accessing the historical rates or time series endpoint of any API, you can be able to examine price volatility that dates back decades.