Detecting Commodity Price Fluctuations For Smarter Trading Decisions
By
Ejaz Ahmed2 Jan 2026 • 9 min read
Commodity price fluctuations describe how the prices of raw materials move up and down over time. These moves can be small and steady or sharp and sudden, depending on market conditions. A clear commodity price fluctuation definition helps traders separate normal movement from real signals.
Short-term changes help with timing, while long-term shifts shape strategy and risk planning. Traders, analysts, and risk teams watch both because each tells a different story. Ignoring one often leads to poor decisions.
Not every price move matters. Some changes are noise, while others show a deeper shift in supply, demand, or sentiment.
This blog explains why commodity prices fluctuate. How to measure them, and how to use data to trade with more confidence.
What Causes Commodity Price Fluctuations

The following are the key causes for commodity price fluctuation:
Supply and Demand
Supply and demand sit at the center of commodity markets. A supply cut or demand spike can push prices quickly in either direction. This is often the starting point of intense commodity price fluctuations.
Economic Condition
Big economic shifts move prices, too. Inflation, interest rates, and currency strength all play a role in how commodities trade. When the dollar strengthens, many commodity prices tend to ease.
Geopolitics
Geopolitics often makes markets harder to predict. Trade bans, sanctions, or regional conflicts can break supply chains very quickly. When that happens, commodity prices fluctuate wildly.
Weather
Weather patterns matter more than many expect. Droughts, floods, and seasonal cycles heavily affect crops and energy demand. Agricultural commodity price fluctuation often starts with weather shocks.
Speculation
Speculation and futures trading amplify movement. Investor sentiment can push prices far from physical supply realities. This explains why a commodity that fluctuates in price may move faster than fundamentals suggest.
Understanding Price Data Before Analyzing Fluctuations
Price analysis only works when the data is solid. Clean commodity prices help you see real movement. Bad data makes commodity price risk harder to control and blurs what real price fluctuations actually look like.
Spot prices show what raw materials cost right now. Futures prices show what traders expect later. Confusing the two increases price risk and weakens decisions.
Units and currencies need to match. Raw materials trade in barrels, tons, or ounces, usually priced in USD. This keeps global comparisons simple.
Missing data creates problems. Delays stretch price moves and distort trends. These gaps can break fixed price contracts. They can also create price fluctuations, even when nothing has truly changed.
Types Of Commodity Price Fluctuations Traders Should Track
Intraday Fluctuations
Intraday moves show immediate pressure inside commodity markets. Prices react quickly to news, orders, and demand pressures. These swings help fast traders respond, but price volatility is often high.
Daily Price Structure
Daily open, high, low, and close prices show how the day actually played out. You can see where buying slowed down and where selling took over. This makes commodity prices fluctuations easier to judge without getting distracted by short-term noise.
Short-Term Trend Shifts
Short-term shifts form over several days or weeks. They often reflect changes in sentiment, supply flow, or energy prices. Many traders use these moves to follow early price trends.
Medium-Term Volatility Phases
Markets sometimes stay unstable for weeks. Prices jump with no clear direction. That uncertainty raises financial risk management concerns. This phase calls for tighter risk management controls.
Long-Term Structural Changes
Long-term moves come from regulation, technology, or scarcity. Global commodity prices, including corn prices, show a clearer structure here. Commodity raw materials price fluctuations make more sense at this scale.
Using Historical Data To Detect Meaningful Fluctuations
Price movement needs context to make sense. Without history, every change feels big. That is why commodity price fluctuations analysis depends on long datasets.
Older data shows normal price behavior. It sets clear limits for commodity price volatility. Over time, you can easily judge the highly fluctuating commodity prices.
Comparing today’s prices with those of the past cuts through the noise. A small price move can come from normal global demand factors in one market. That same move can point to stress in wheat prices when domestic supply is tight.
Short datasets mislead decisions. They hide global demand shocks and other global shocks. A longer history helps mitigate risk when weak demand drives global commodity price fluctuations.
Measuring Commodity Price Fluctuations Programmatically
Absolute price change is the first check. It shows how far trading prices moved in real units. Commodity buyers use this to track production costs during supply disruptions.
Percentage change adds balance. It makes agricultural commodities easier to compare despite different price levels. This matters when commodity price increases hit unevenly due to global demand.
Looking at start and end prices shows the full move. It helps spot trend strength during global supply shocks. Weekly or monthly views keep the signal clean.
Day-over-day moves show momentum. Repeated shifts make the direction clearer. Sharp flips point to a higher risk.
Automated endpoints help to reduce manual work. They support financial stability. This matters for commodity price fluctuations risk management.
Interpreting Fluctuation Data For Smarter Trading Decisions
Volatility can look loud, but it is not a signal by itself. Higher commodity prices do not always point to opportunity. Staying calm helps avoid bad trades during market uncertainty.
Price ranges tell a clearer story. Higher lows or lower highs often show direction. This keeps traders from reacting to noise.
When ranges tighten, momentum weakens. Reversals often follow. This helps lock in gains.
Fluctuation data works better with volume and momentum. It also supports accurate demand forecasting used by risk teams and the World Bank.
Real-World Use Cases Of Commodity Price Fluctuations
Energy traders follow oil and gas prices throughout the day. Changes in oil supply or sudden demand shocks can move prices without warning. These markets often show intense and significant fluctuations.
Metals traders focus on gold and silver during uncertain periods. When the economy slows down, investors usually look for safer places to park money. Small price moves often show up before a bigger trend takes shape.
Agricultural buyers plan purchases around seasons and harvest cycles. Weather, labor shortages, and supply chain issues affect output. Agricultural commodity price fluctuation often leads to increased prices and contract changes.
Fintech platforms track commodity price fluctuations through alerts and dashboards. Fast signals help users act quickly.
Portfolio managers use commodities for balance and financial hedging. The impact of commodity price fluctuations influences how assets are allocated.
Common Mistakes When Analyzing Commodity Price Fluctuations
Many traders fixate on price increases from a single session. One day of movement rarely explains the trend. This habit often leads to overtrading and adds extra cost.
History is skipped too easily. Higher prices may look extreme today, but appear normal when compared to the same period in past years. Without that view, judgment slips.
Currency mistakes are another issue. Mixing USD and non-USD data inflates commodity prices fluctuations, especially in global commodity analysis across many countries.
Markets also behave differently. Fossil fuels react differently from crops or metals, even under high demand. Treating certain commodities the same hides real risk.
Short-term models often fail. Conditions change fast. Simple logic survives better.
Building A Simple Fluctuation Monitoring Workflow
Start with a short list of commodities that match your strategy. Focus on markets where price moves have a significant impact on your results. Tracking everything adds noise.
Pick clear time windows that fit your goal. Daily or monthly views support different types of economic activity. Stay consistent.
You can set thresholds using historical prices. This helps in better structural interpretation. It also filters random movement.
Automate checks where you can. Manual work often misses patterns. Alerts help you act faster. Let's build it now.
Tech Stack
- Frontend: React.js
- Backend: Node.js + Express
- API: CommodityPriceAPI
- Port setup:
- Backend: http://localhost:4000
- Frontend: http://localhost:3000
Step 1: Setup Backend (Node.js + Express)
Create Project Folder
mkdir commodity-monitor
cd commodity-monitor
mkdir server client
Initialize Backend
cd server
npm init -y
Install Dependencies
npm install express node-fetch cors dotenvCreate index.js
server/index.js:
import express from "express";
import cors from "cors";
import fetch from "node-fetch";
import dotenv from "dotenv";

dotenv.config();

const app = express();
app.use(cors());
app.use(express.json());

const API_KEY = process.env.COMMODITY_API_KEY;
const BASE_URL = "https://api.commoditypriceapi.com/v2";

// Fluctuation Endpoint
app.get("/api/fluctuation", async (req, res) => {
  try {
    const { symbols, startDate, endDate } = req.query;
    if (!symbols || !startDate || !endDate) {
      return res.status(400).json({ error: "Missing query parameters" });
    }

    const response = await fetch(
      `${BASE_URL}/fluctuation?symbols=${symbols}&startDate=${startDate}&endDate=${endDate}&apiKey=${API_KEY}`
    );

    const data = await response.json();
    res.json(data);
  } catch (err) {
    console.error(err);
    res.status(500).json({ error: "Server error" });
  }
});

// Latest Rates Endpoint (optional)
app.get("/api/latest", async (req, res) => {
  try {
    const { symbols } = req.query;
    if (!symbols) {
      return res.status(400).json({ error: "Missing symbols" });
    }

    const response = await fetch(
      `${BASE_URL}/rates/latest?symbols=${symbols}&apiKey=${API_KEY}`
    );

    const data = await response.json();
    res.json(data);
  } catch (err) {
    console.error(err);
    res.status(500).json({ error: "Server error" });
  }
});

const PORT = 4000;
app.listen(PORT, () => console.log(`Backend running at http://localhost:${PORT}`));
1.5 Add .env File
server/.env:
COMMODITY_API_KEY=YOUR_API_KEY_HERE- Replace YOUR_API_KEY_HERE with your CommodityPriceAPI key
- Important: never expose API keys in frontend
Step 2: Setup Frontend (React js)
Initialize React App
cd ../client
npx create-react-app .
Add Proxy for Backend
client/package.json → add proxy line:
{
  "name": "client",
  "version": "0.1.0",
  "private": true,
  "proxy": "http://localhost:4000",
  "dependencies": { ... },
  "scripts": { ... }
}
This allows /api/... requests in React to go to backend automatically.
Replace App.js With Working Code
client/src/App.js:
import { useEffect, useState } from "react";

const SYMBOLS = ["XAU", "WTIOIL-FUT", "XAG"];
const ALERT_THRESHOLD = 2; // percent

export default function App() {
  const [data, setData] = useState([]);
  const [alerts, setAlerts] = useState([]);

  useEffect(() => {
    loadFluctuations();
    const timer = setInterval(loadFluctuations, 60000); // refresh every 60 sec
    return () => clearInterval(timer);
  }, []);

  async function loadFluctuations() {
    try {
      // Fetch fluctuation data from backend
      const res = await fetch(
        `/api/fluctuation?symbols=${SYMBOLS.join(",")}&startDate=2025-12-01&endDate=2025-12-31`
      );

      if (!res.ok) {
        console.error("Failed to fetch data", res.status);
        return;
      }

      const json = await res.json();

      // Map JSON to rows
      const rows = Object.entries(json.rates || {}).map(([symbol, values]) => ({
        symbol,
        startRate: values.startRate,
        endRate: values.endRate,
        change: values.change,
        changePercent: values.changePercent,
      }));

      setData(rows);

      // Check alerts
      const triggered = rows.filter(
        (r) => Math.abs(r.changePercent) >= ALERT_THRESHOLD
      );
      setAlerts(triggered);
    } catch (error) {
      console.error("Error loading data:", error);
    }
  }

  return (
    <div style={{ padding: 20 }}>
      <h1>Commodity Price Monitor</h1>

      <table border="1" cellPadding="8">
        <thead>
          <tr>
            <th>Symbol</th>
            <th>Start</th>
            <th>End</th>
            <th>Change</th>
            <th>% Change</th>
          </tr>
        </thead>
        <tbody>
          {data.map((row) => (
            <tr key={row.symbol}>
              <td>{row.symbol}</td>
              <td>{row.startRate}</td>
              <td>{row.endRate}</td>
              <td>{row.change}</td>
              <td>{row.changePercent.toFixed(2)}%</td>
            </tr>
          ))}
        </tbody>
      </table>

      {alerts.length > 0 && (
        <>
          <h2 style={{ color: "red" }}>⚠ Alerts</h2>
          <ul>
            {alerts.map((a) => (
              <li key={a.symbol}>
                {a.symbol} moved {a.changePercent.toFixed(2)}%
              </li>
            ))}
          </ul>
        </>
      )}
    </div>
  );
}
Step 3: Run Backend & Frontend
Terminal 1: Backend
cd server
node index.js
Terminal 2: Frontend
cd client
npm start
- Open browser: http://localhost:3000
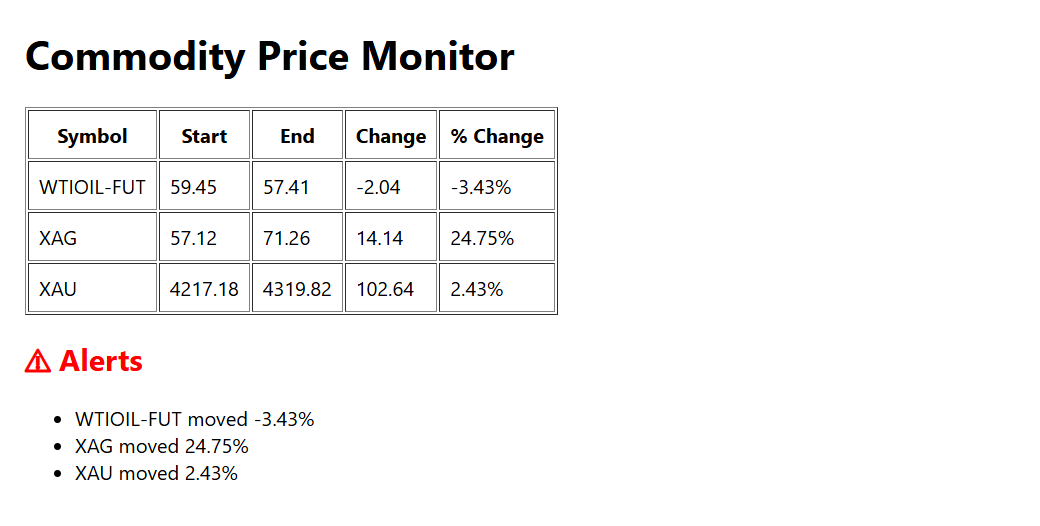
- You should see:
✅ Commodity table
✅ Start / End / Change / % Change
✅ Alerts if change % > 2%
✅ Auto-refresh every 60 seconds
Step 4: Test & Debug
- Backend: http://localhost:4000/api/fluctuation?symbols=XAU,... → should return JSON
- Frontend: check console → no Unexpected token '<'
- Table updates automatically every 60 sec
You can access the complete code here.
Conclusion
Commodity price fluctuations should not be treated as noise alone. When read with care, they explain how markets react and why moves happen. Real discipline comes from tracking patterns, not chasing sudden shifts.
Clean and consistent data matters more than gut feeling. History helps calm reactions during global recessions and periods of stress. It also reduces the incomplete identification of real signals.
Additional fluctuations in commodity prices often start with sudden weather conditions or supply shocks. Changes in agricultural products can also push prices out of balance.
With the right structure and context, commodity price fluctuations current behavior becomes easier to track. This clarity supports smarter and steadier decisions.
FAQs
What Are Commodity Price Fluctuations?
Commodity price fluctuations show how commodity prices rise and fall over time. These moves happen when supply changes, demand shifts, or expectations in the market adjust.
How Are Commodity Price Fluctuations Different From Volatility?
Fluctuations describe actual price movement. Volatility measures how unpredictable that movement is statistically.
Why Is Historical Data Important For Analyzing Commodity Price Fluctuations?
History shows what is normal and what is extreme. It reduces false signals and improves confidence.
Can Commodity Price Fluctuations Be Tracked In Real Time?
Yes, commodity price fluctuations can be tracked in real time. Prices update often with trading. This makes it easier to watch changes live and act quickly when alerts fire.
How Do APIs Help Detect Commodity Price Fluctuations More Accurately?
APIs help to automate calculations and updates. They improve consistency, speed, and scalability across systems.