Predicting Commodity Price Trends Using Historical Data And Fluctuations
By
Ejaz Ahmed26 Dec 2025 • 12 min read
Commodity markets move fast, but the patterns behind them often move more slowly than people expect. Prices move up, drop down, slow, and repeat in patterns that leave clear signals behind. When you learn to spot those signals, Commodity Price Trends become much easier to understand.
Trends help traders, analysts, and developers ignore short-term price noise. They highlight the broader market direction instead of every small movement. This makes decisions steadier, clearer, and more confident.
Historical data matters a lot here. Past price behavior shows how commodities react to supply shocks, demand shifts, and global events. Fluctuations then add context by showing how strong or fragile those moves really are.
Understanding Commodity Price Trends is not about prediction magic. So, by carefully reading the history, you can spot the repeated signals.
Understanding The Nature Of Commodity Markets Price Trends
Commodity Price Trends usually fall into three broad shapes. Prices can move upward in an uptrend, drift lower in a downtrend, or stay flat in a sideways market. Each shape tells a different story about supply, demand, and market confidence.
Trend duration behaves differently in commodities compared to stocks. Commodity prices fluctuate because of weather, political changes, and supply runs on tight cycles. Stock prices usually move around earnings, company performance, and longer growth stories.
Commodities react strongly to macro and supply signals. A drought, trade restriction, or energy shortage can change prices overnight. These forces heavily affected commodity price trends across metals, energy, and food markets.
Importance Of Historical Commodity Price Data
Commodity Price Trends have memory, including agricultural commodity price trends. Markets often react the same way when similar conditions show up again. Long-term data helps you spot those repeated patterns instead of guessing.
Data going back to 1990 helps you see long-term trends commodity prices clearly. It covers booms, crashes, supply shocks, and long recoveries. That history makes Commodity Price Trends more stable and easier to trust.
Short data windows can fool you. A few months of prices may look dramatic, but often reflect noise, not direction. This is one of the most common mistakes in commodity price trend analysis.
Why Long-Term Historical Data Matters for Futures Prices
- Shows how commodity markets behave across full economic cycles
- Helps separate real trends from short-term price spikes
- Improves context when analyzing futures prices
- Reveals how different commodities react to stress and recovery
- Makes price movement easier to compare over time
Historical depth also adds practical clarity. Commodities like corn respond to weather, storage levels, and demand in familiar ways. Seeing how prices moved before helps explain why they move again.
Without enough history, analysis stays shallow. With regular updates, Commodity Price Trends become clearer, calmer, and far more useful.
Key Data Types Used For Trend Prediction
Open, high, low, and close prices form the backbone of trend work. Daily OHLC data shows how prices behaved throughout each session. It reveals rejection levels, strong closes, and failed breakouts.
Price ranges show how strong a trend really is. When the range stays tight, the market is taking a pause. When the range starts to widen, momentum is picking up.
Time-series price data shows how prices move step by step. It records values at the same time each day. This makes long-term price patterns easier to spot. You can see how commodity prices rise, fall, or remain consistent over time.
Fluctuation data helps you know the price and percentage difference. It shows how far prices traveled between two points. Fluctuation endpoints are especially useful for spotting momentum shifts.
The energy price index eased 0.4% in November, driven by a 4.3% decline in European natural gas prices.
Preparing Historical Data For Trend Analysis
Raw price data needs cleaning before analysis. When days are missing or numbers repeat, results stop being reliable. Fixing these issues improves clarity.
Normalization matters when comparing commodities, especially in December. Prices for gold, wheat, and oil move on very different scales. Normalizing allows commodity price trends to be compared fairly.
Units and quote currencies also need attention. Some prices use barrels, others tons or ounces. Handling this correctly avoids false signals in global commodity price trends.
Techniques To Predict Commodity Price Trends
Moving Averages And Trend Smoothing
Moving averages make busy price charts easier to read. A simple moving average shows the general direction and ignores tiny swings. It works well for spotting steady Commodity Price Trends.
Exponential moving averages pay more attention to what just happened. This makes them useful when markets shift quickly. Many traders compare both to understand short and long momentum.
Crossover Signals And Trend Shifts
Crossovers happen when one moving average passes another. A short-term average crossing above a long-term one often signals strength. This setup appears often across commodity markets.
When the opposite happens, it can warn of weakness. Crossovers are easy to see on charts and simple to track. They work best when combined with other signals.
Rate Of Change And Momentum Speed
The rate of change focuses on how fast prices move. It does not care about direction at first. It only measures speed.
A rising rate of change shows acceleration. This helps identify early shifts in future Commodity Price Trends. It works well for fast-moving commodities like oil priced per barrel.
Percentage Fluctuation For Conviction Checks
Percent moves give prices more meaning. Sharp jumps show strong belief behind the move. Quiet shifts usually mean people are waiting.
This metric helps filter weak signals. It turns raw data into something easier to judge. Many analysts place these values in a simple table for quick comparison.
Trend Channels And Price Structure
Trend channels map structure over time. They are drawn from historical highs and lows. These lines highlight support and resistance zones.
Prices often bounce within these channels. Breakouts can signal major moves and commodity prices' top trends. This approach works well for crops like soybeans and metals alike.
Food prices were up 2.4%, while beverages fell 1.6% and raw materials declined 1.1%.
Using Fluctuation Analysis To Confirm Trends
Fluctuation analysis compares start and end rates over time. It shows whether the price movement is meaningful or shallow. This helps separate real trends from short-lived spikes and spot commodity prices long-term trends.
Strong trends often show up as steady progress over time. Exhaustion starts when those moves lose strength or begin to turn. This behavior shows up clearly in gold commodity price trend analysis and helps highlight the commodity prices top trends.
Combining fluctuation data with time-series signals strengthens confidence. One confirms direction while the other confirms strength. Together, they clarify affected commodity price trends.
Building A Simple Commodity Price Trend Model
The first step is selecting the right symbols. Choose commodities with strong liquidity and consistent data. Metals, energy, and major crops work well, especially when studying agricultural commodities price trends.
Next comes the date range. Longer ranges capture structure, while shorter ranges capture timing. Balancing both improves insight into commodity prices trend behavior, including the aluminum commodity price trend.
Historical data shows context. Time-series data shows direction. Fluctuation data shows strength.
Interpreting output matters as much as building the model. Numbers should guide decisions, not dictate them. Clear trends matter more than trying to predict the exact price.
Gold appreciated over 27% in 2024 to break $2,600 per ounce.
Using CommodityPriceAPI for Commodity Price Trend Analysis
In this section, we will use the Historical and Fluctuation endpoints of CommodityPriceAPI to explore how commodity prices change over time, analyze trends, and visualize fluctuations in an interactive dashboard.
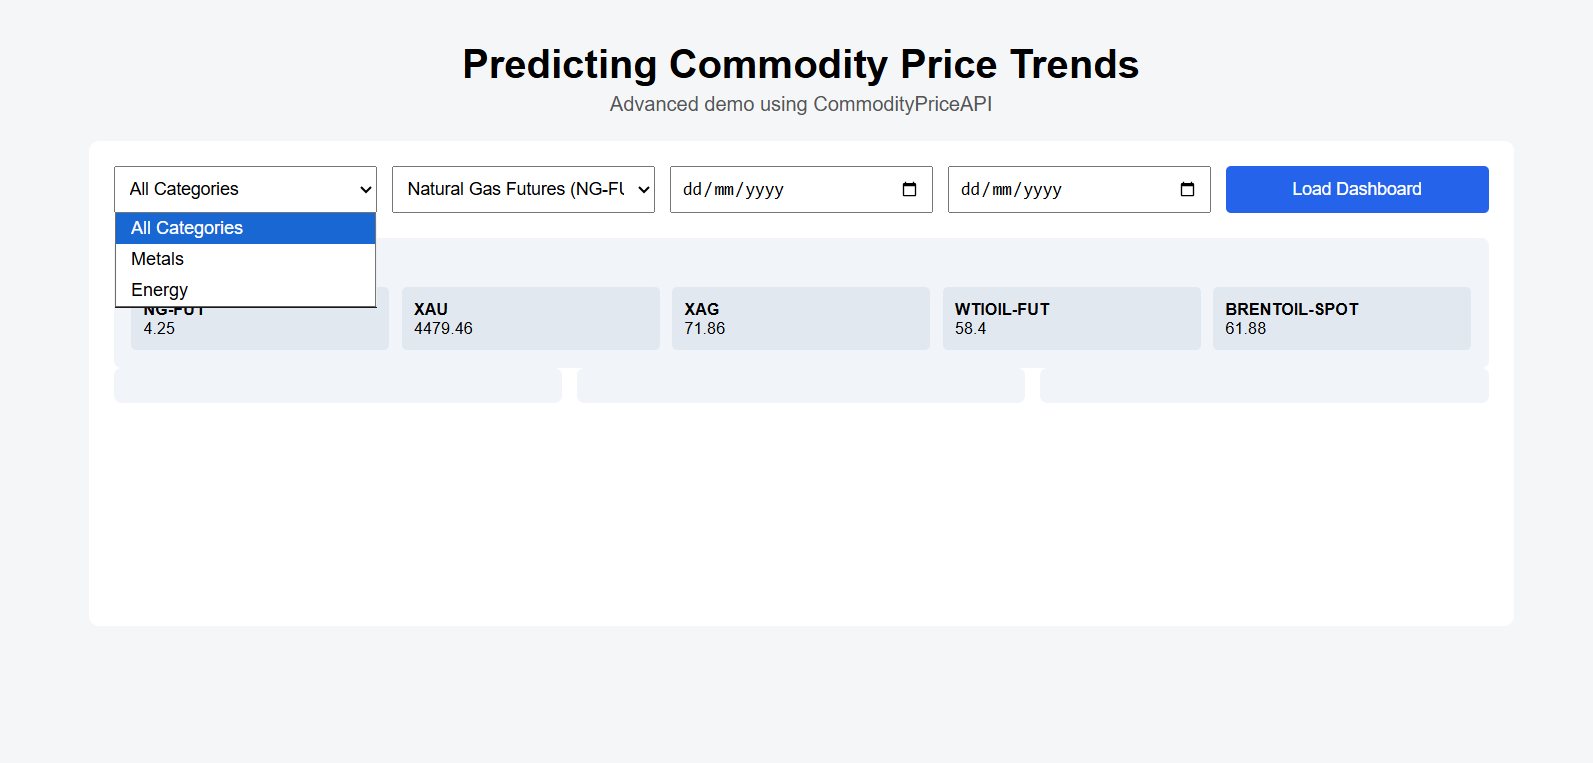
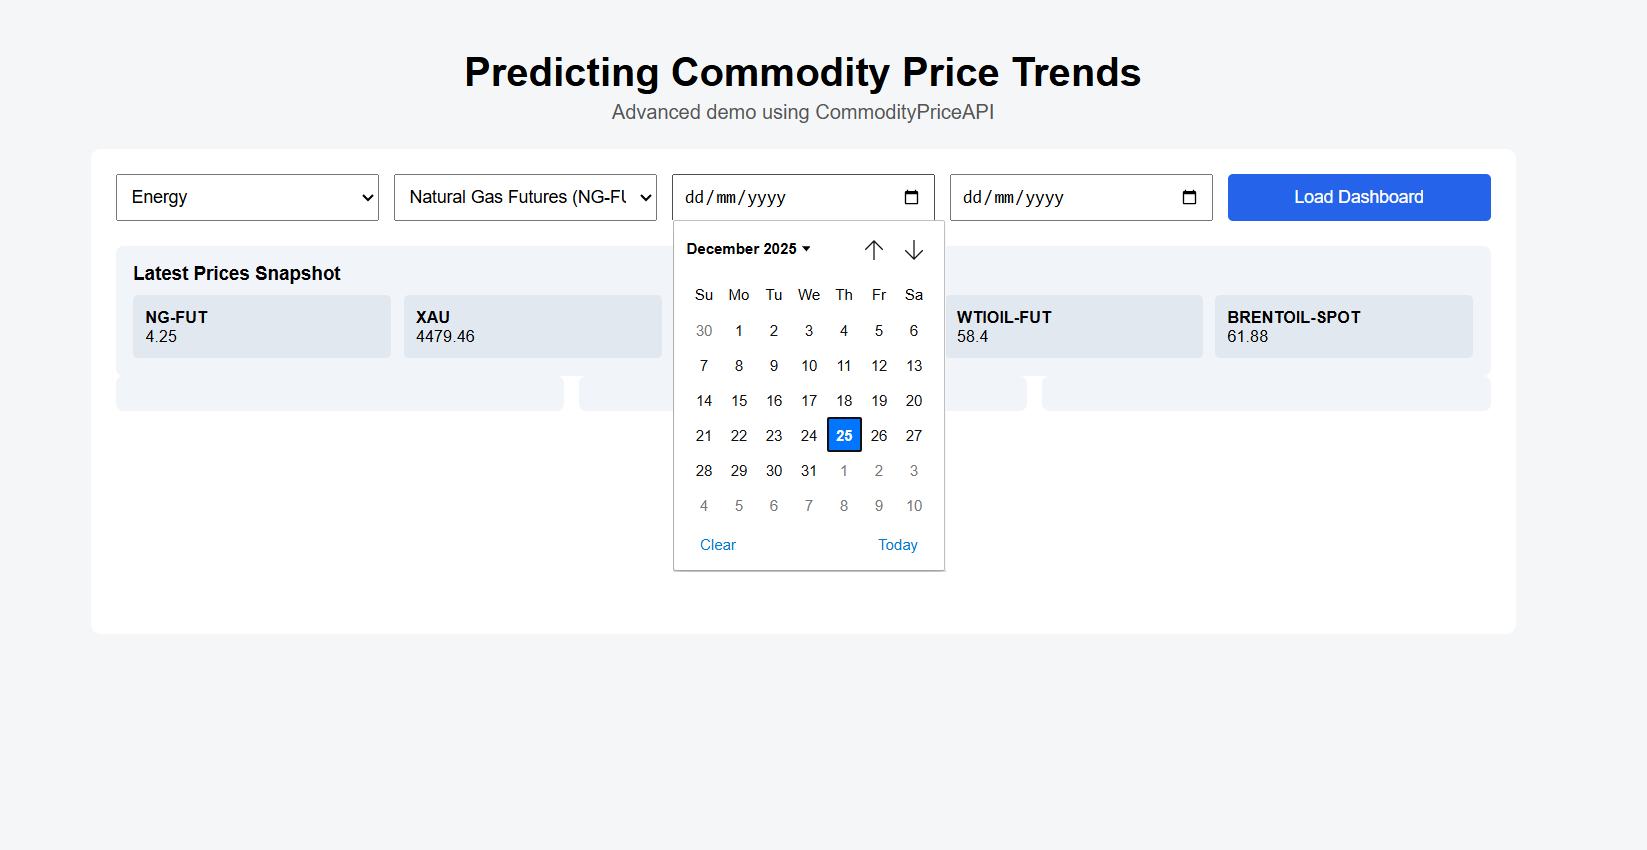
Step 1: Selecting a Commodity and Date Range
Users start by choosing a commodity from the dropdown menu and selecting a date range using the date pickers. For example:
- Category: Energy
- Commodity: Crude Oil Brent Spot (BRENTOIL-SPOT)
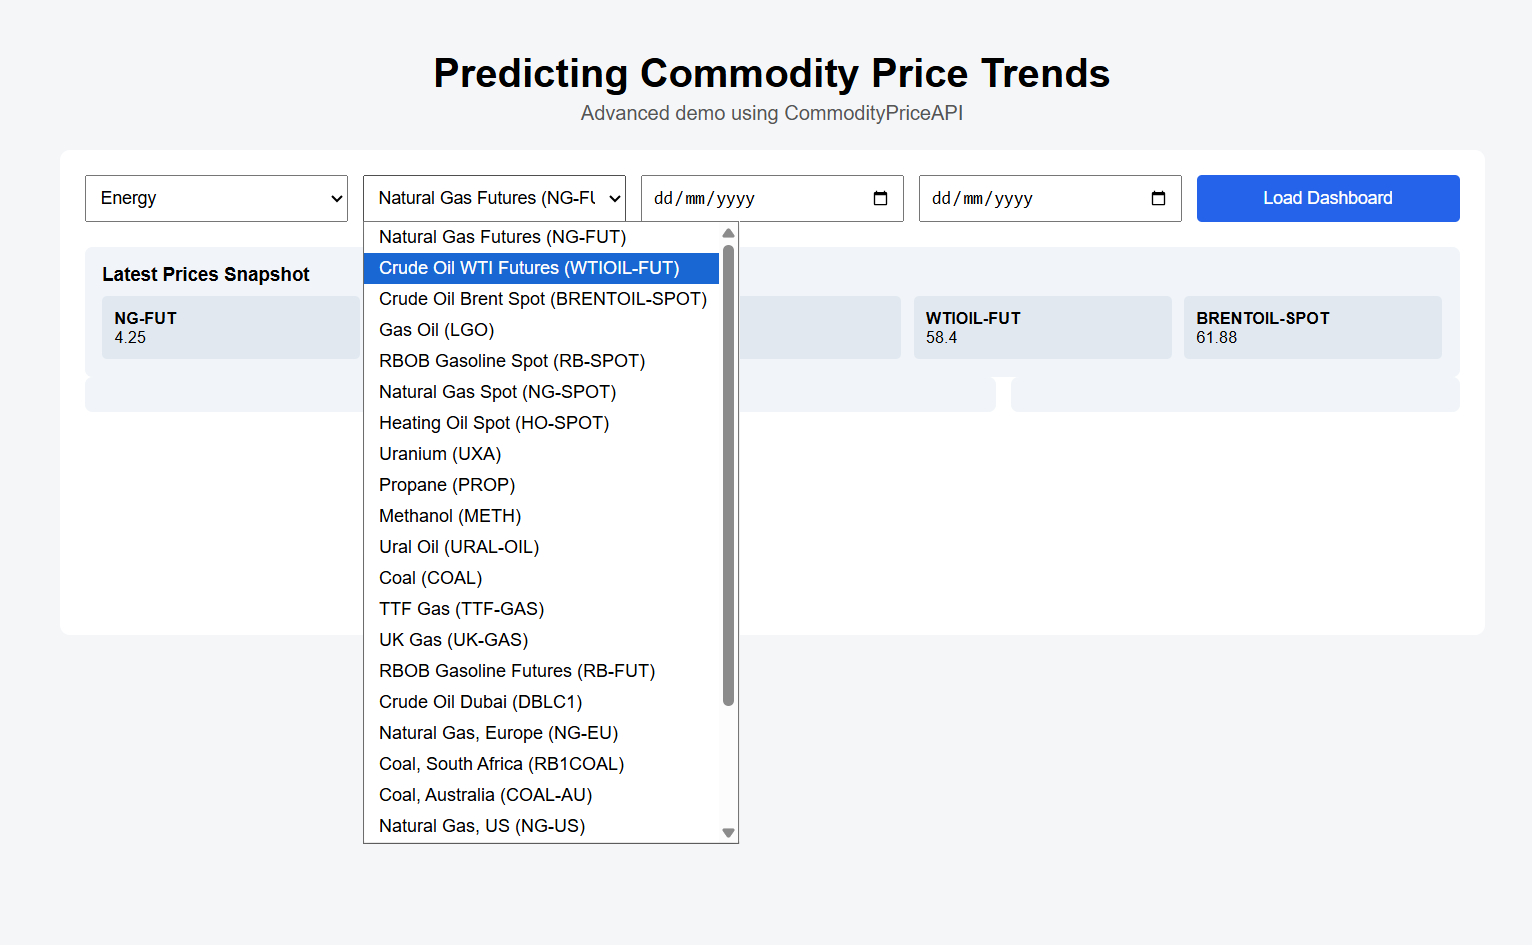
- Date Range: 14/10/2025 – 09/12/2025

This selection sets the scope of the analysis and determines which data will be fetched from the API.
Step 2: Loading the Dashboard
After making your selections, click the Load Dashboard button. This triggers the dashboard to fetch data from the API:
- Historical Endpoint: Retrieves daily open, high, low, and close prices for the selected commodity within the chosen date range.
- Fluctuation Endpoint: Calculates the price change and percentage change between the start and end dates.
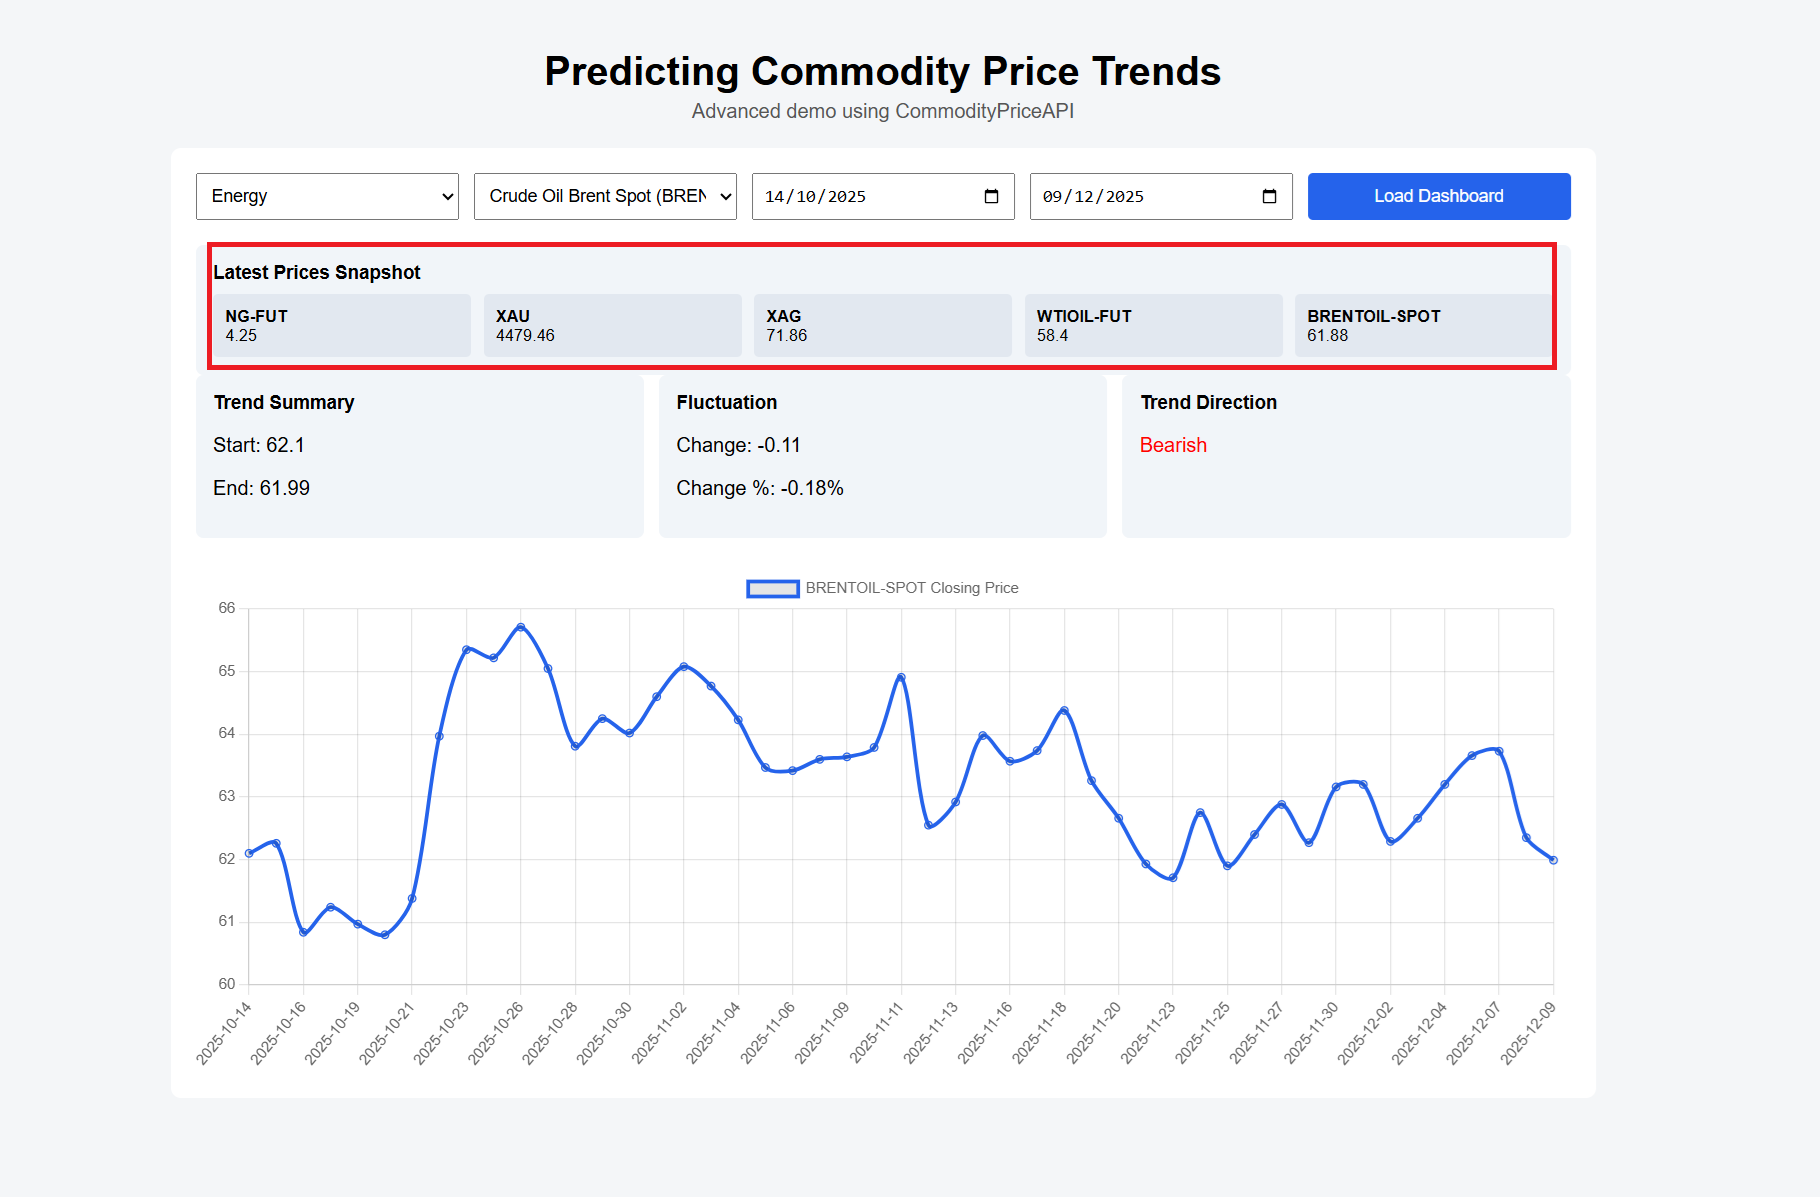
Step 3: Viewing Latest Prices Snapshot
The Latest Prices Snapshot shows the most recent prices for multiple commodities at a glance. For example:
Commodity | Latest Price |
NG-FUT | 4.25 |
XAU | 4479.46 |
XAG | 71.86 |
WTIOIL-FUT | 58.4 |
BRENTOIL-SPOT | 61.88 |
This snapshot allows users to quickly understand current market rates for several commodities simultaneously.
Step 4: Analyzing Trend Summary
The Trend Summary displays the starting and ending prices for the selected date range. For example:
- Start: 62.1
- End: 61.99
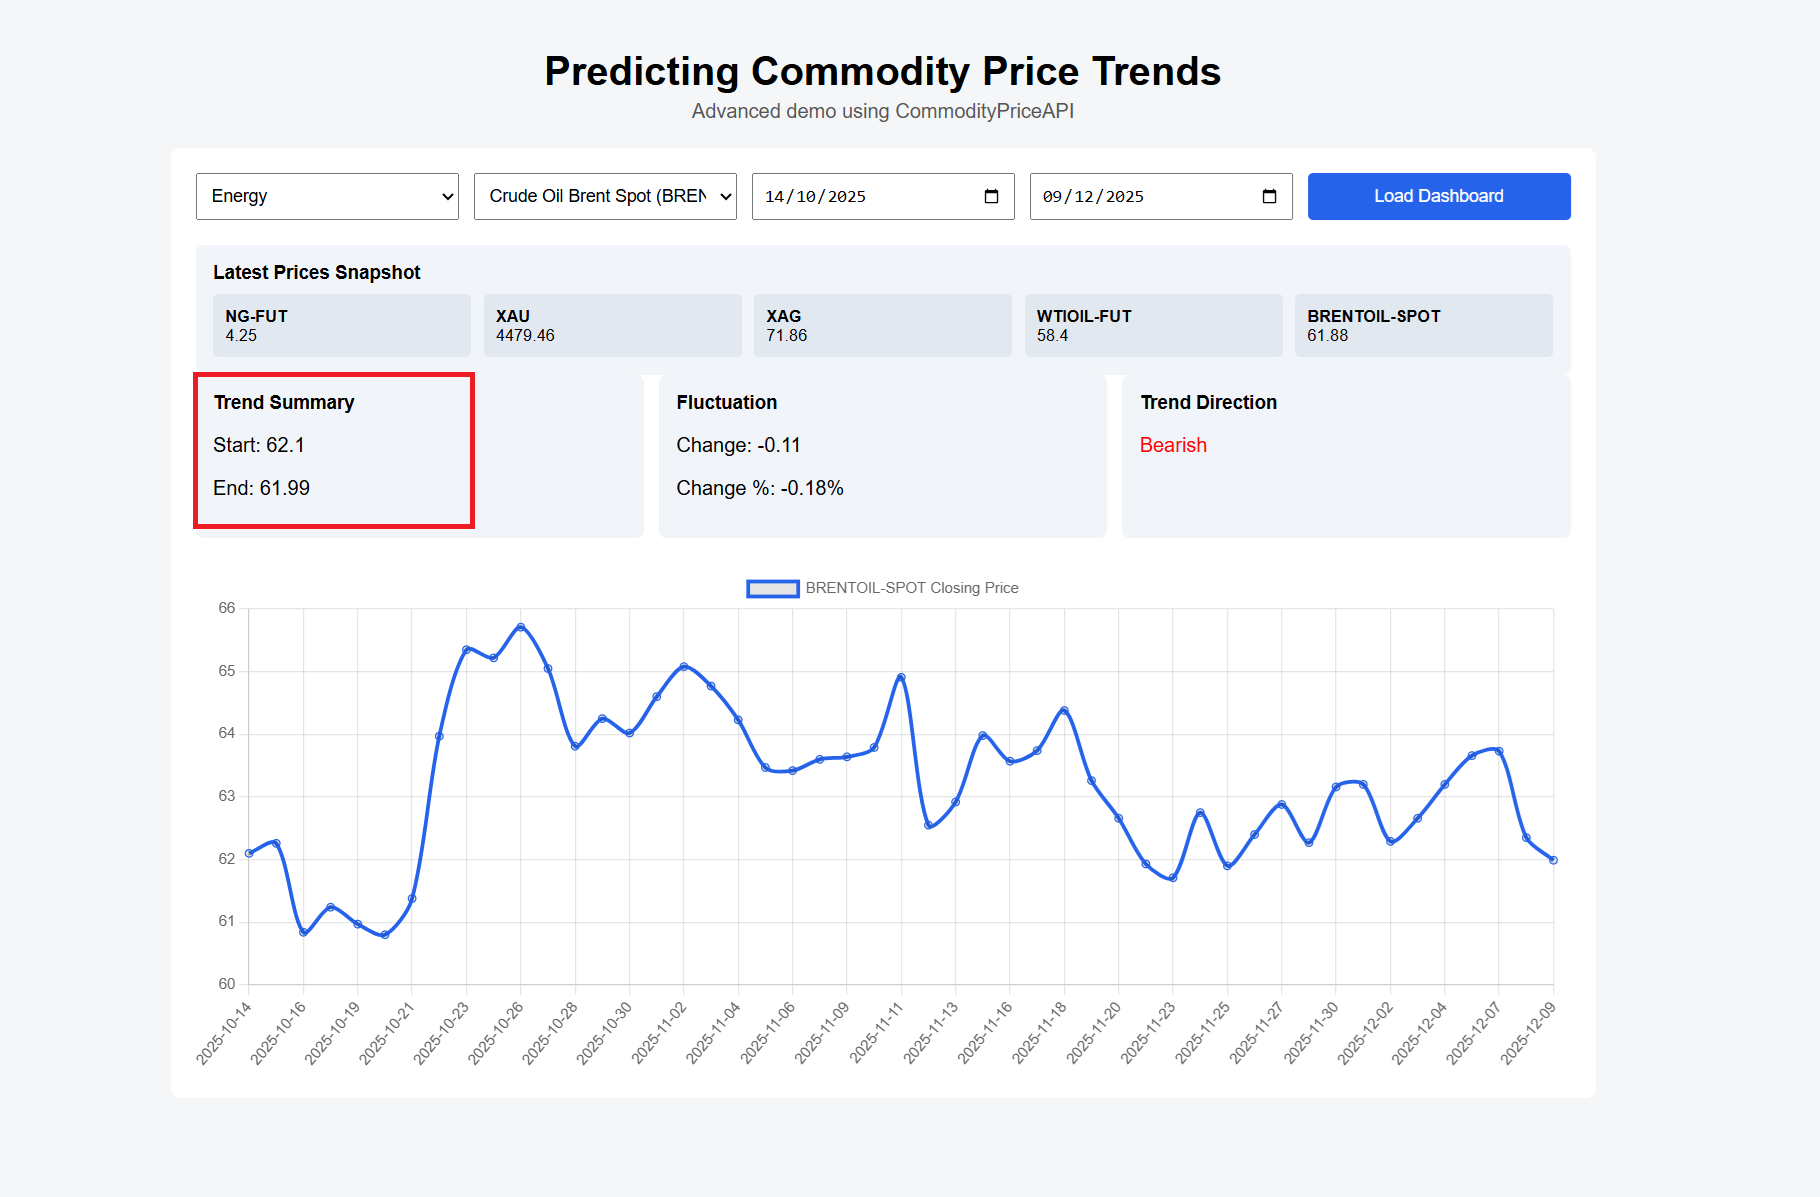
By comparing these values, users can quickly gauge whether the commodity price increased, decreased, or remained relatively stable.
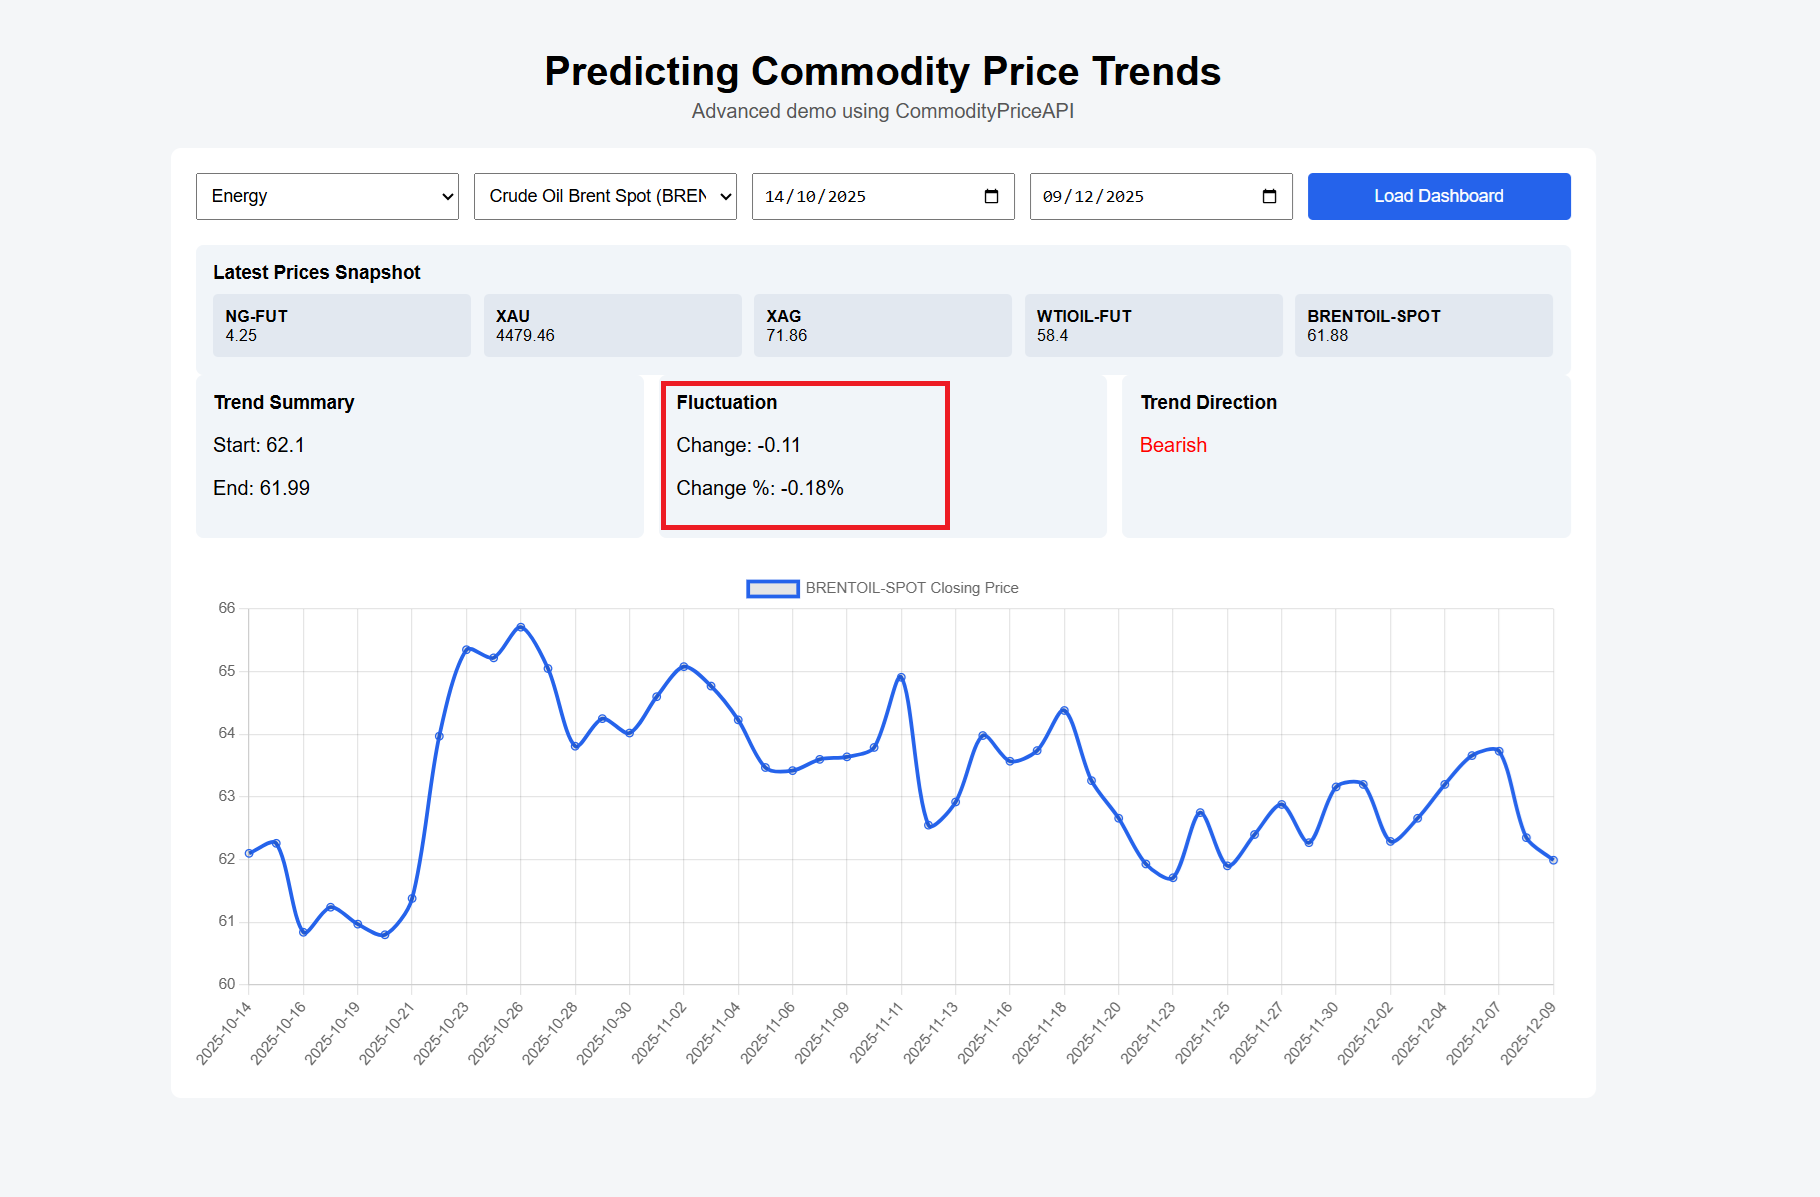
Step 5: Fluctuation Analysis
The Fluctuation card shows the absolute and percentage change over the selected period:
- Change: -0.11
- Change %: -0.18%
Step 6: Trend Direction
Based on the historical and fluctuation data, the dashboard automatically determines the trend direction:
- Example: Bearish
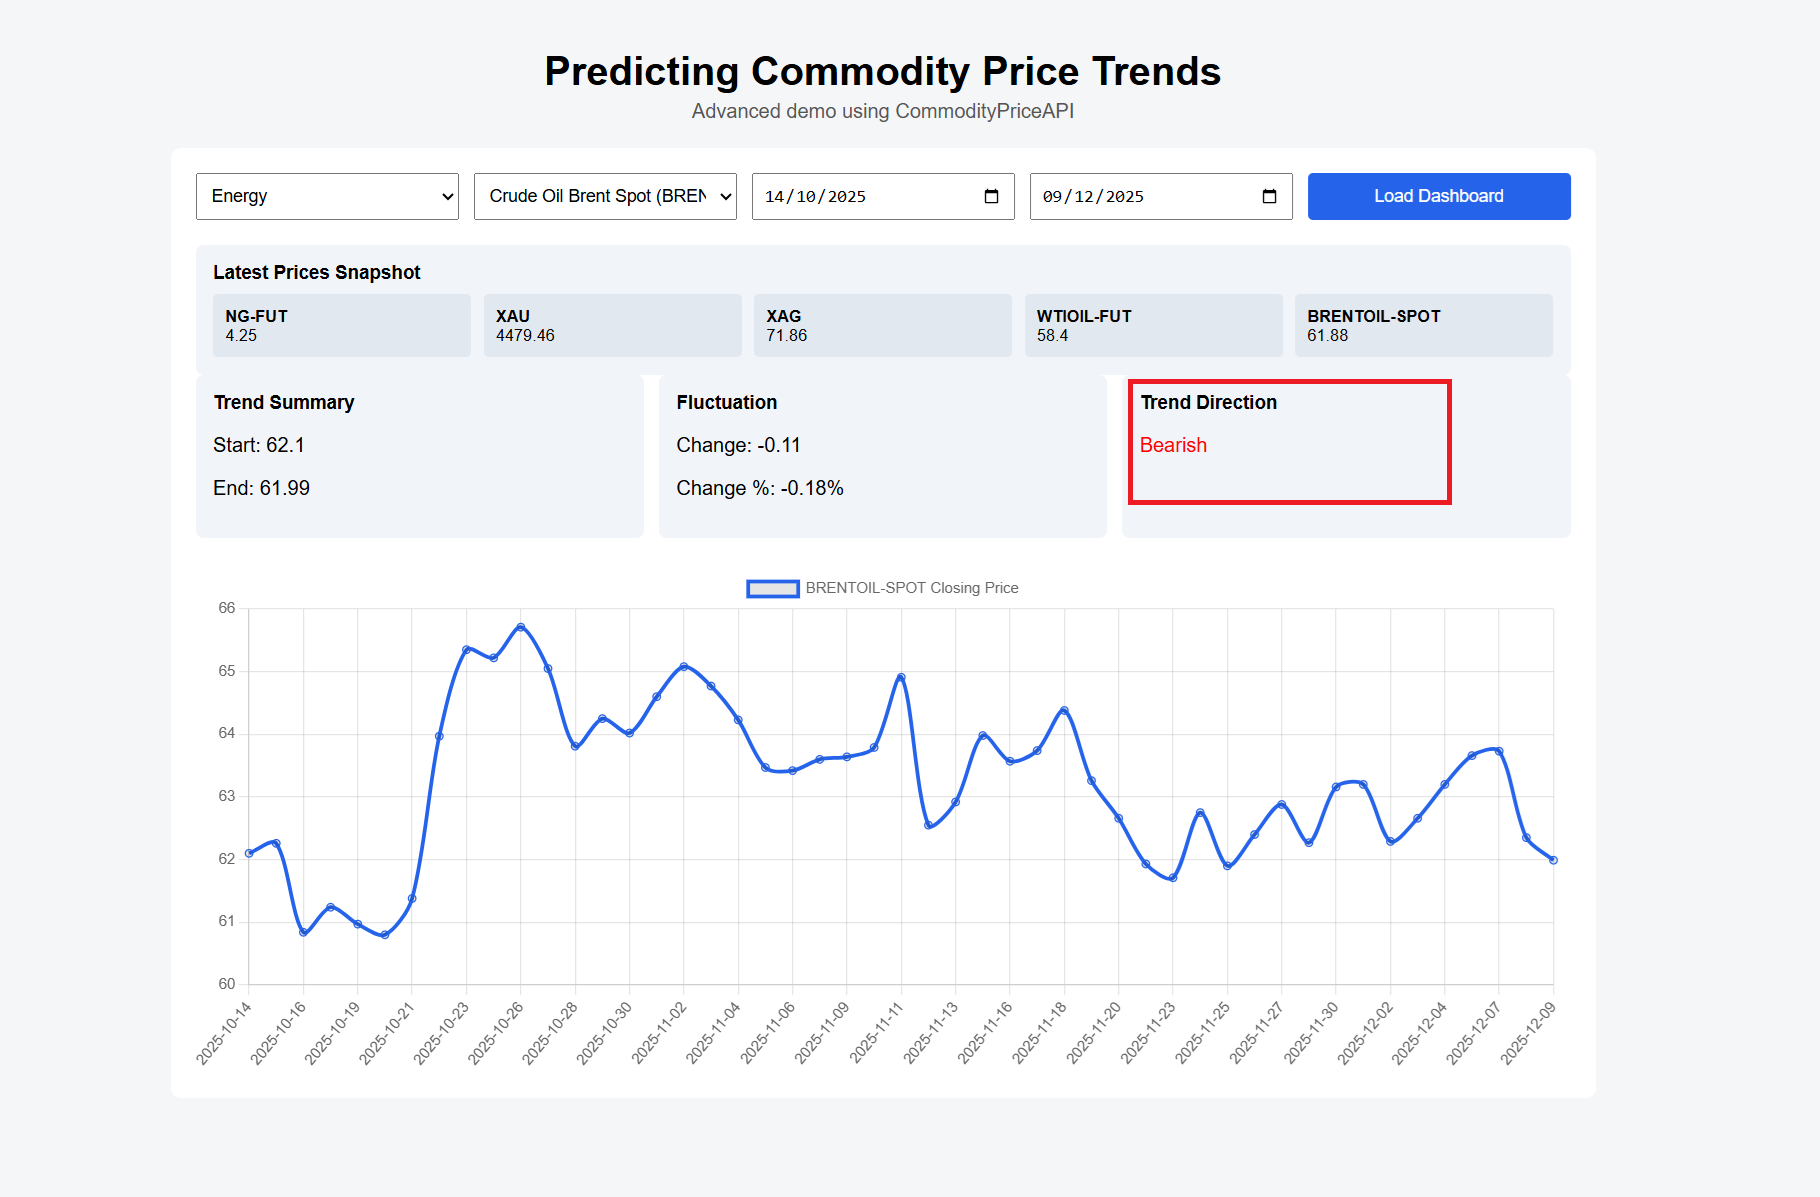
The trend classification helps users quickly interpret market conditions without manually calculating price changes.
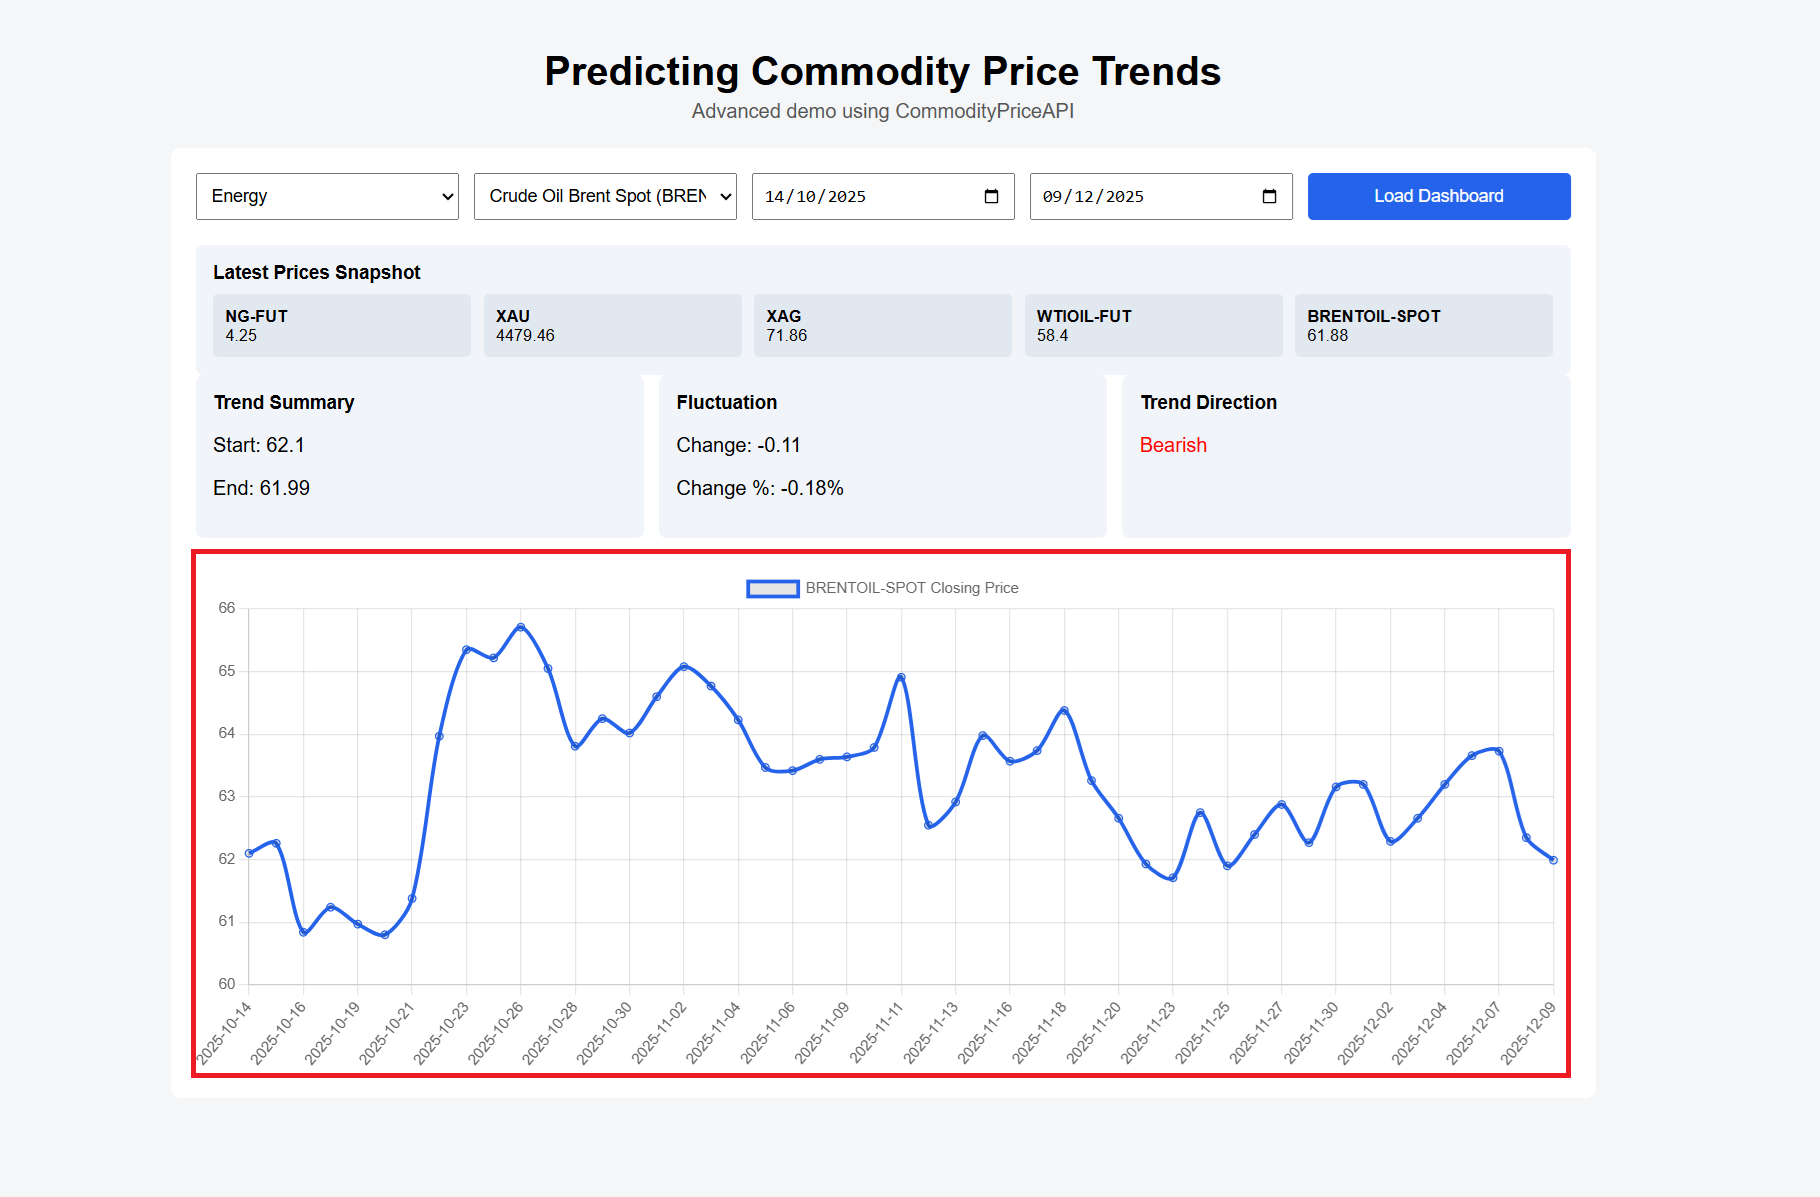
Step 7: Visualizing Trends with Charts
The dashboard includes a time-series chart that plots the commodity’s closing prices over the selected date range. This visualization allows users to:
- Identify patterns and trends over time
- Compare starting and ending prices visually
- Make informed decisions for trading, investment, or market analysis
Complete Code
Note: You can also access the complete code here.
<!DOCTYPE html>
<html lang="en">
<head>
<meta charset="UTF-8" />
<title>Advanced Commodity Price Dashboard</title>

<script src="https://cdn.jsdelivr.net/npm/chart.js@4.4.1/dist/chart.umd.min.js"></script>

<style>
body {
  font-family: Arial, sans-serif;
  background: #f4f6f8;
  padding: 20px;
}
h1 { text-align: center; margin-bottom: 5px; }
.subtitle { text-align: center; color: #555; margin-bottom: 20px; }

.container {
  max-width: 1100px;
  margin: auto;
  background: #fff;
  padding: 20px;
  border-radius: 8px;
}

.controls {
  display: grid;
  grid-template-columns: repeat(auto-fit, minmax(180px, 1fr));
  gap: 12px;
  margin-bottom: 20px;
}

select, input, button {
  padding: 8px;
  font-size: 14px;
}

button {
  background: #2563eb;
  color: #fff;
  border: none;
  border-radius: 4px;
  cursor: pointer;
}
button:hover { background: #1e40af; }

.cards {
  display: grid;
  grid-template-columns: repeat(auto-fit, minmax(220px, 1fr));
  gap: 12px;
  margin-bottom: 20px;
}

.card {
  background: #f1f5f9;
  padding: 14px;
  border-radius: 6px;
}
.card h3 { margin: 0 0 8px; font-size: 15px; }

.grid {
  display: grid;
  grid-template-columns: repeat(auto-fit, minmax(160px, 1fr));
  gap: 10px;
}

.grid div {
  background: #e2e8f0;
  padding: 10px;
  border-radius: 4px;
  font-size: 13px;
}

.trend.up { color: green; }
.trend.down { color: red; }
.trend.flat { color: #555; }

canvas { margin-top: 25px; }
</style>
</head>

<body>

<h1>Predicting Commodity Price Trends</h1>
<div class="subtitle">Advanced demo using CommodityPriceAPI</div>

<div class="container">

  <!-- Controls -->
  <div class="controls">
    <select id="category" onchange="filterSymbols()">
      <option value="all">All Categories</option>
      <option value="Metals">Metals</option>
      <option value="Energy">Energy</option>
    </select>

    <select id="symbolSelect"></select>

    <input type="date" id="startDate" />
    <input type="date" id="endDate" />

    <button onclick="loadDashboard()">Load Dashboard</button>
  </div>

  <!-- Snapshot -->
  <div class="card">
    <h3>Latest Prices Snapshot</h3>
    <div class="grid" id="latestGrid">Loading…</div>
  </div>

  <!-- Info Cards -->
  <div class="cards">
    <div class="card" id="infoCard"></div>
    <div class="card" id="fluctuationCard"></div>
    <div class="card" id="trendCard"></div>
  </div>

  <!-- Chart -->
  <canvas id="chart" height="110"></canvas>

</div>

<script>
const API_KEY = "add-your-api-key-here";
const BASE = "https://api.commoditypriceapi.com/v2";

let symbols = [];
let chart;

// Load symbols on start
(async function init() {
  const res = await fetch(`${BASE}/symbols`, {
    headers: { "x-api-key": API_KEY }
  });
  const data = await res.json();
  symbols = data.symbols.filter(s => s.status === "active");
  populateSymbols(symbols);
  loadLatestSnapshot();
})();

function populateSymbols(list) {
  const select = document.getElementById("symbolSelect");
  select.innerHTML = "";
  list.forEach(s => {
    const opt = document.createElement("option");
    opt.value = s.symbol;
    opt.textContent = `${s.name} (${s.symbol})`;
    select.appendChild(opt);
  });
}

function filterSymbols() {
  const cat = document.getElementById("category").value;
  const filtered = cat === "all"
    ? symbols
    : symbols.filter(s => s.category === cat);
  populateSymbols(filtered);
}

// Latest snapshot (multi-commodity)
async function loadLatestSnapshot() {
  const topSymbols = symbols.slice(0, 5).map(s => s.symbol).join(",");
  const res = await fetch(`${BASE}/rates/latest?symbols=${topSymbols}`, {
    headers: { "x-api-key": API_KEY }
  });
  const data = await res.json();

  const grid = document.getElementById("latestGrid");
  grid.innerHTML = "";

  Object.entries(data.rates).forEach(([sym, price]) => {
    grid.innerHTML += `<div><strong>${sym}</strong><br>${price}</div>`;
  });
}

async function loadDashboard() {
  const symbol = document.getElementById("symbolSelect").value;
  const start = document.getElementById("startDate").value;
  const end = document.getElementById("endDate").value;

  if (!start || !end) {
    alert("Select start and end dates");
    return;
  }

  await loadTimeSeries(symbol, start, end);
  await loadFluctuation(symbol, start, end);
}

// Time-series chart
async function loadTimeSeries(symbol, start, end) {
  const res = await fetch(
    `${BASE}/rates/time-series?symbols=${symbol}&startDate=${start}&endDate=${end}`,
    { headers: { "x-api-key": API_KEY } }
  );
  const data = await res.json();

  const labels = [];
  const prices = [];

  for (const date in data.rates) {
    labels.push(date);
    prices.push(data.rates[date][symbol].close);
  }

  renderChart(labels, prices, symbol);
  renderInfo(symbol, prices);
}

// Fluctuation + trend
async function loadFluctuation(symbol, start, end) {
  const res = await fetch(
    `${BASE}/rates/fluctuation?symbols=${symbol}&startDate=${start}&endDate=${end}`,
    { headers: { "x-api-key": API_KEY } }
  );
  const data = await res.json();
  const f = data.rates[symbol];

  document.getElementById("fluctuationCard").innerHTML = `
    <h3>Fluctuation</h3>
    <p>Change: ${f.change}</p>
    <p>Change %: ${f.changePercent}%</p>
  `;
}

// Info + trend logic
function renderInfo(symbol, prices) {
  const start = prices[0];
  const end = prices[prices.length - 1];
  const diff = end - start;

  let trend = "Sideways";
  let cls = "flat";

  if (diff > 0) { trend = "Bullish"; cls = "up"; }
  if (diff < 0) { trend = "Bearish"; cls = "down"; }

  document.getElementById("infoCard").innerHTML = `
    <h3>Trend Summary</h3>
    <p>Start: ${start}</p>
    <p>End: ${end}</p>
  `;

  document.getElementById("trendCard").innerHTML = `
    <h3>Trend Direction</h3>
    <p class="trend ${cls}">${trend}</p>
  `;
}

function renderChart(labels, data, symbol) {
  if (chart) chart.destroy();

  chart = new Chart(document.getElementById("chart"), {
    type: "line",
    data: {
      labels,
      datasets: [{
        label: `${symbol} Closing Price`,
        data,
        borderColor: "#2563eb",
        tension: 0.3
      }]
    }
  });
}
</script>

</body>
</html>
Common Pitfalls When Predicting Commodity Price Trends
Overfitting short-term noise is common. Models can latch onto random movement. This leads to fragile predictions.
Overlooking outside factors is another common mistake. Weather, policy, and logistics all matter. These forces shape farm commodity price trends and energy markets alike.
Assuming all commodities behave the same causes errors. Agricultural cycles differ from metals. Commodity crop price trends follow seasonal rhythms that oil does not.
Practical Use Cases Of Commodity Price Trend Prediction
Traders use trends to time entries and exits. They do not panic over daily price moves. That calm approach keeps decisions steady.
Businesses track trends to manage risk. Energy buyers use them to lock in costs early. Aluminium price trends help the manufacturers in predicting the raw material expenses.
Developers build dashboards around trends. These tools track food commodity prices trends along with broader commodity price trends. Visual context helps teams make faster decisions.
Conclusion
Strong analysis starts with good history. Consistent historical data reveals a structure that short snapshots miss. This improves accuracy across commodity prices and long-term trends.
Fluctuation-based confirmation adds discipline. It helps show whether a price move in USD actually matters. That extra check helps you stay grounded.
Repeatable analysis comes from structured data access. Historical, time-series, and fluctuation endpoints work best together. When used consistently, Commodity Price Trends become clearer, calmer, and far more useful.
FAQs
What Are Commodity Price Trends?
Commodity price trends show how a commodity’s price moves over time. They are based on past price changes and recurring patterns.
How Much Historical Data Is Needed To Predict Commodity Price Trends?
Longer datasets provide stronger context. Multiple years reduce noise and improve reliability.
Why Are Fluctuations Important in Trend Analysis?
Fluctuations show how prices shift from one point to the next. They help you tell if a trend is picking up or losing steam.
Can Commodity Price Trends Be Predicted Accurately?
Predictions get better when you look at more than one signal. Relying on a single number rarely tells the full story.
Which Commodities Are Best For Trend Analysis?
Markets that trade a lot are easier to read. Gold, oil, silver, and natural gas tend to show clearer price trends.