Integrate Commodity Prices API into Your App in Minutes
By
Ejaz Ahmed29 Dec 2025 • 9 min read

Commodity prices influence more apps than most people realize. Finance tools track metals, logistics platforms follow fuel, and e-commerce systems watch raw material costs. All of this depends on access to a reliable commodity prices api.
A delivery app needs fuel prices to estimate costs accurately. A trading app sends alerts when gold moves. An agriculture dashboard tracks crop pricing trends.
Developers often hit the same problems. Data is stale, feeds break, and integrations take too long. This guide shows how to pull live and historical prices quickly using a clean JSON approach.
What Are Commodity Prices
Commodity prices show the market value of physical goods like metals, energy, and crops. These prices shift with supply, demand, and global events. Over the years, historical commodity prices have helped explain these changes.
Unlike stocks, commodities come from real production. Weather, transport, and politics all affect pricing. Looking at historical data reveals long-term patterns.
Apps using commodity prices need accuracy and timely updates. Small changes can impact entire industries. Structured access keeps decisions grounded.
Real Life Use Cases of Commodity Prices
1) Fuel tracking is common in logistics apps. Teams monitor natural gas and oil costs. When financial data is accurate, shipping estimates stay closer to real costs.
2) Agriculture tools rely on agricultural commodities pricing. Farmers study trends before decisions. Historical prices add useful context.
3) Investment platforms track metals and energy. Gold and oil act as hedges. Real time commodity prices help users move fast.
Real Life Apps That Use Commodity Prices
- Trading apps show live commodity charts. Users track metals and energy across global markets. Speed matters for quick decisions.
- Supply chain tools run quietly in the background. Prices feed forecasts using secure api keys. Small changes affect long-term planning.
- Analytics dashboards bring internal metrics together with a commodities API. Teams can compare real time prices with historical data easily. Context leads to smarter decisions.
Why Integrate Commodity Data Using APIs
APIs save you from building pricing pipelines across different programming languages. You avoid tracking exchange rates for precious metals and crude oil yourself. That alone removes a lot of complexity.
Clear api endpoints return structured data in one request. You get the latest closing price without scraping exchanges. Formats stay consistent and easy to handle.
An api for commodity prices reduces errors and build time. Infrastructure is no longer your burden. Scaling becomes simpler and more predictable.
What Makes Commodity Data Hard to Integrate
Commodity data comes from many exchanges and formats. One feed may track live cattle futures while another reports heating oil or agricultural products like palm oil. Pulling this together with clean real time data takes work.
Updates also vary by market. Some sources share live data every minute, others post a daily opening price. Mixing real-time and historical streams makes scaling harder and more expensive.
Overview of CommodityPriceAPI
CommodityPriceAPI is built for speed and clarity. It returns the current price through a REST API. You authenticate using an x api key.
It covers 130 plus commodities. This includes metals and energy products. Data comes from trusted financial institutions.
Historical data starts in 1990. You can compare the lowest price and the highest price easily. Each plan applies a clear rate limit.
Getting Started in Minutes: Setup and Authentication
Creating an Account and API Key
Getting started takes only a few minutes and requires no credit card. You create an account, get an API key from the dashboard, and gain instant access to commodity data and prices. The key lets you track how you use the API. It also helps you try the latest endpoint and make better decisions with the data.
Authentication Methods
You can send the API key as a query parameter, which works well for server-side access. You can also pass it in the x-api-key header, as shown in the api documentation, for cleaner and more secure requests. Always keep keys off the client side to protect your commodity data and api access.
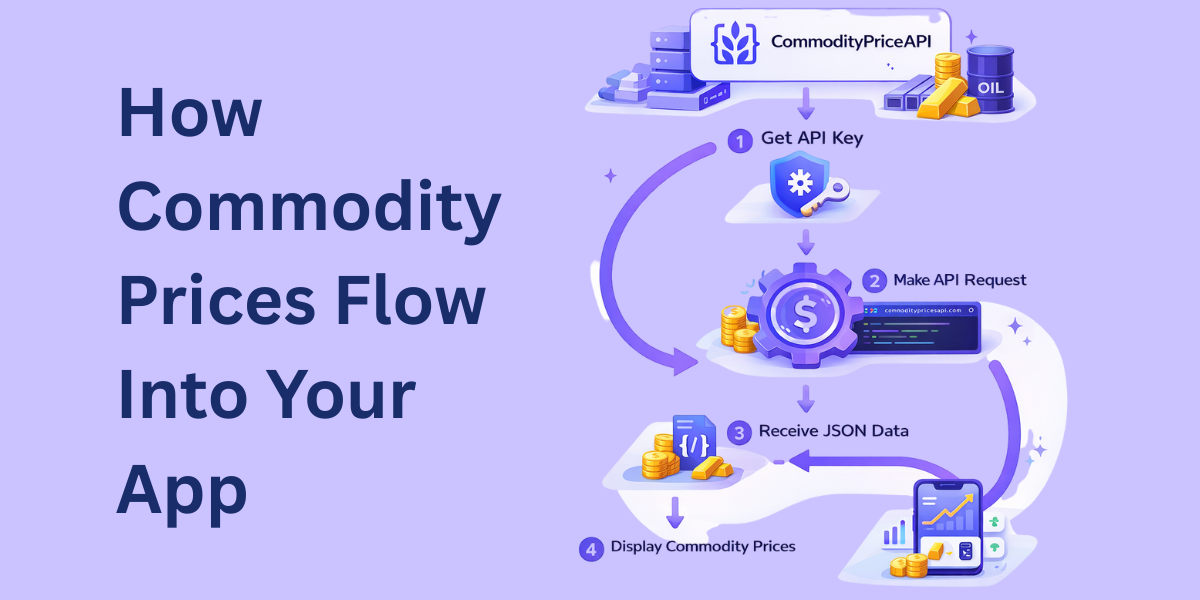
Fetching Live Commodity Prices
This section explains how real time pricing works. You fetch metals and energy data without delay. Traders and users get prices they can trust.
Latest Rates Endpoint
The latest rates endpoint returns real time prices. You pass each commodity symbol you need, like gold or energy assets. Multiple symbols in one call reduce code and keep performance tight.
$ curl "https://api.commoditypriceapi.com/v2/rates/latest?symbols=xau,wtioil-fut" -H "x-api-key: YOUR_API_KEY"Response Sample for Informed decisions:
{
  "success": true,
  "timestamp": 1703866777,
  "rates": {
    "WTIOIL-FUT": 72.29,
    "XAU": 2066.98
  },
  "metaData": {
    "XAU": {
      "unit": "T.oz",
      "quote": "USD"
    },
    "WTIOIL-FUT": {
      "unit": "Bbl",
      "quote": "USD"
    }
  }
}
You can choose a custom quote currency instead of the default. This keeps the account logic simple and easy to follow. Prices stay consistent for users across the system.
Example Use Cases
Some of the common use cases include finance apps showing gold and energy prices. Dashboards refresh often, based on plan limits. Traders see changes without noise.
Alerts help in watching the price levels in real time. When thresholds break, users get notified. This makes real time data useful.
Understanding the API Response
Each response includes a timestamp. It shows when the price was generated. This helps with caching.
Rates come as clear key value pairs. Metadata explains currency and units. Developers read and debug fast.
Working with Historical Commodity Prices
Historical Rates Endpoint
Historical queries use a clear date format, written as YYYY-MM-DD. You ask for prices for a specific date, and the endpoint returns what is available. This works well for commodities like coal, where daily tracking matters.
Many commodities return open, high, low, close, and volume data. This supports analysis, charting, and market comparisons. The structure matches common financial standards and is easy to integrate.
If data is missing, the API uses the nearest available rate. Charts stay smooth, and gaps do not show. Your message stays consistent across tools.
Endpoint:
$ curl "https://api.commoditypriceapi.com/v2/rates/historical?symbols=xau,wtioil-fut&date=2019-01-04" -H "x-api-key: YOUR_API_KEY"Sample Response for Common Use Cases:
{
  "success": true,
  "date": "2019-01-04",
  "rates": {
    "XAU": {
      "date": "2019-01-04",
      "open": 1295.17,
      "high": 1298.49,
      "low": 1276.6,
      "close": 1284.81
    },
    "WTIOIL-FUT": {
      "date": "2019-01-04",
      "open": 46.9,
      "high": 49.22,
      "low": 46.65,
      "close": 47.96
    },
    "TEAM": {
      "date": "2025-04-01",
      "open": 0,
      "high": 0,
      "low": 0,
      "close": 2.11
    }
  }
}
Time-Series Data
Time-series endpoints return daily prices across a date range. The maximum range is one year to keep responses fast. This makes time series data easy to work with.
This data helps with trend analysis and backtesting. It also makes reporting and historical reviews easier. Over time, patterns are easier to spot.
Some monthly commodities return closing prices only. That reflects how those markets operate. The data stays realistic and reliable.
Endpoint:
$ curl "https://api.commoditypriceapi.com/v2/rates/time-series?symbols=xau,wtioil-fut&startDate=2023-12-08&endDate=2023-12-13" -H "x-api-key: YOUR_API_KEY"Response example:
{
  "success": true,
  "startDate": "2023-12-08",
  "endDate": "2023-12-13",
  "rates": {
    "2023-12-08": {
      "XAU": {
        "open": 2027.93,
        "high": 2033.89,
        "low": 1994.49,
        "close": 2004.35
      },
      "WTIOIL-FUT": {
        "open": 69.34,
        "high": 71.63,
        "low": 69.5,
        "close": 71.23
      }
    },
    "2023-12-10": {
      "XAU": {
        "open": 2005.5,
        "high": 2007.44,
        "low": 2004.43,
        "close": 2006.93
      },
      "WTIOIL-FUT": {
        "open": 71.25,
        "high": 71.66,
        "low": 70.92,
        "close": 71.47
      }
    },
    "2023-12-11": {
      "XAU": {
        "open": 2006.92,
        "high": 2007.62,
        "low": 1975.76,
        "close": 1982.79
      },
      "WTIOIL-FUT": {
        "open": 71.4,
        "high": 71.92,
        "low": 71.36,
        "close": 71.92
      }
    },
    "2023-12-12": {
      "XAU": {
        "open": 1982.79,
        "high": 1996.48,
        "low": 1977.09,
        "close": 1982.44
      },
      "WTIOIL-FUT": {
        "open": 68.72,
        "high": 68.88,
        "low": 68.26,
        "close": 68.43
      }
    },
    "2023-12-13": {
      "XAU": {
        "open": 1982.44,
        "high": 2033.06,
        "low": 1972.91,
        "close": 2032.68
      },
      "WTIOIL-FUT": {
        "open": 69.91,
        "high": 70.17,
        "low": 69.67,
        "close": 69.83
      }
    }
  }
}
Fluctuation Data
Fluctuation endpoints focus on price movement over time. They show start and end prices for a chosen period. The difference is calculated automatically.
You also get percentage changes in the same response. This helps highlight volatility clearly. Comparisons become quick and visual.
Analytics tools use this format because it is simple. It lets teams create summaries without extra work. Price movement is easy to see at a glance.
Endpoint:
$ curl "https://api.commoditypriceapi.com/v2/rates/fluctuation?symbols=xau,wtioil-fut&startDate=2023-12-08&endDate=2023-12-13" -H "x-api-key: YOUR_API_KEY"Response Example:
{
  "success": true,
  "startDate": "2023-12-08",
  "endDate": "2023-12-13",
  "rates": {
    "WTIOIL-FUT": {
      "startRate": 71.23,
      "endRate": 69.83,
      "change": -1.4,
      "changePercent": -1.97
    },
    "XAU": {
      "startRate": 2004.35,
      "endRate": 2032.68,
      "change": 28.33,
      "changePercent": 1.41
    }
  }
}
How to Integrate CommodityPriceAPI into Your App Within Minutes?
Make sure that you have your API key.
Next, choose the desired endpoint.
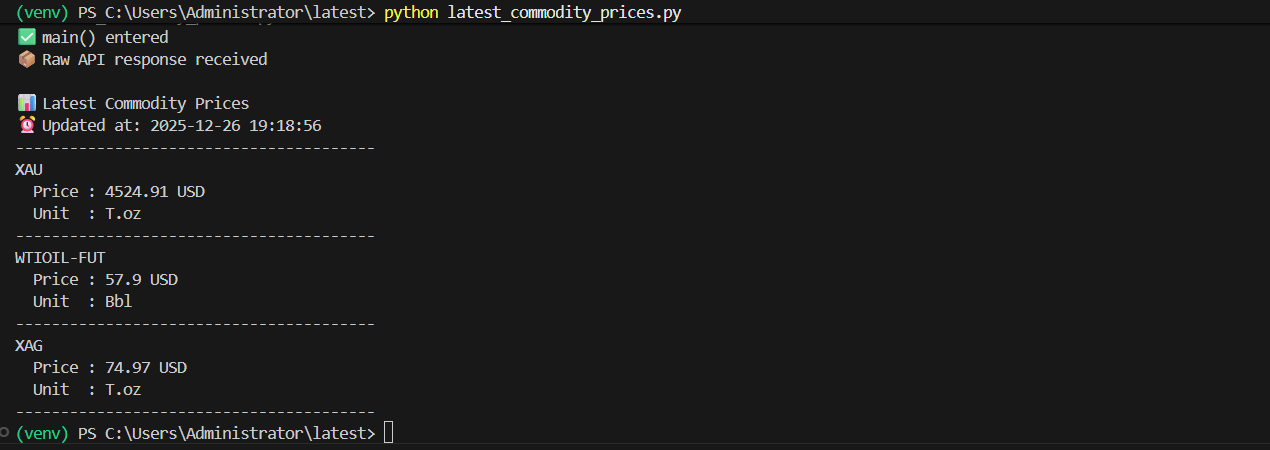
Finally, integrate it within your app. Here is an example to integrate the latest endpoint within a Python code:
import requests
import os
from datetime import datetime

# -----------------------------
# DEBUG: CONFIRM FILE EXECUTION
# -----------------------------
print("🚀 latest_commodity_prices.py started")

# -----------------------------
# CONFIGURATION
# -----------------------------
API_KEY = os.getenv("COMMODITY_API_KEY")
BASE_URL = "https://api.commoditypriceapi.com/v2/rates/latest"

SYMBOLS = ["XAU", "WTIOIL-FUT", "XAG"]

# -----------------------------
# FUNCTION TO FETCH LATEST RATES
# -----------------------------
def get_latest_rates(symbols):
    params = {
        "symbols": ",".join(symbols)
    }

    headers = {
        "x-api-key": API_KEY
    }

    response = requests.get(BASE_URL, params=params, headers=headers)
    response.raise_for_status()
    return response.json()

# -----------------------------
# MAIN SCRIPT
# -----------------------------
def main():
    print("✅ main() entered")

    if not API_KEY:
        print("❌ API key not found. Please set COMMODITY_API_KEY.")
        return

    try:
        data = get_latest_rates(SYMBOLS)

        print("📦 Raw API response received")

        if not data.get("success"):
            print("❌ API returned success = false")
            print(data)
            return

        timestamp = data["timestamp"]
        rates = data["rates"]

        # 🔥 Handle BOTH possible field names
        metadata = data.get("metaData") or data.get("metadata")

        readable_time = datetime.fromtimestamp(timestamp)

        print("\n📊 Latest Commodity Prices")
        print(f"⏰ Updated at: {readable_time}")
        print("-" * 40)

        for symbol, price in rates.items():
            unit = metadata[symbol]["unit"]
            quote = metadata[symbol]["quote"]

            print(f"{symbol}")
            print(f"  Price : {price} {quote}")
            print(f"  Unit  : {unit}")
            print("-" * 40)

    except requests.exceptions.HTTPError as http_err:
        print("❌ HTTP error occurred")
        print(http_err)
    except Exception as err:
        print("❌ Unexpected error occurred")
        print(err)

# -----------------------------
# RUN SCRIPT
# -----------------------------
if __name__ == "__main__":
    main()
Output
Multi-Currency Pricing and Global Apps
Global products need localized pricing. Users expect prices in familiar currencies. CommodityPriceAPI supports this directly.
You can request prices in more than 175 currencies. Conversion happens server-side. Results remain consistent.
This is useful for reports and dashboards. It also supports regional pricing logic. Financial data feels relevant everywhere.
Error Handling, Rate Limits, and Reliability
Errors are part of every integration. The API uses standard HTTP status codes. Each error includes a clear message.
Validation errors explain missing parameters. Rate limit errors signal usage caps. Payment errors appear when plans expire.
You can monitor usage in the dashboard. There is also a usage endpoint. This helps build resilient systems.
Scaling Your Integration
Early prototypes usually make fewer calls to a commodity price API. As traffic grows, usage increases. Choosing the right plan matters as you move toward production.
Batching symbols into one request reduces calls to a real-time commodity prices API. This improves performance without adding complexity. Costs stay under control as volume increases.
Caching also helps at scale when using a free commodity price API. Store prices briefly when real-time updates are not critical. Upgrade when you need faster refresh rates.
Conclusion
Integrating commodity pricing does not need to feel heavy. With the right free commodity prices API, setup takes minutes. Data arrives clean and usable without extra effort.
CommodityPriceAPI keeps things simple as a commodities prices API you can actually use. JSON responses fit modern stacks, and a commodity api with crude oil prices works smoothly alongside other markets. Live and historical data stay in sync.
Try it with a small experiment using a commodity price api free plan. Build faster without managing data pipelines. Commodity data should move your product forward.
FAQs
How Many Commodities Does CommodityPriceAPI Support?
You get access to prices for more than 130 commodities. That covers metals, energy, and agriculture, so one commodity market price api is usually enough for most apps.
Can I Access Historical Commodity Prices?
Yes, you can pull historical prices for most commodities going back to January 1, 1990. It works well as a commodity price data API for charts, reports, and long-term trends.
How Often Are Commodity Prices Updated?
Updates depend on your plan, but higher tiers refresh prices as often as every 60 seconds. That makes it a good fit when you need commodity prices real time api access for dashboards or alerts.
Can I Convert Commodity Prices Into Other Currencies?
Yes, you can request prices in more than 175 currencies. The API handles the conversion for you. It works like a commodity prices live API you can rely on anywhere. Global users get the same clear and updated data.
Is CommodityPriceAPI Suitable For Production Apps?
Yes. It can handle real user traffic without issues. You can start with it as a free API for commodity prices and keep using it as your app grows.