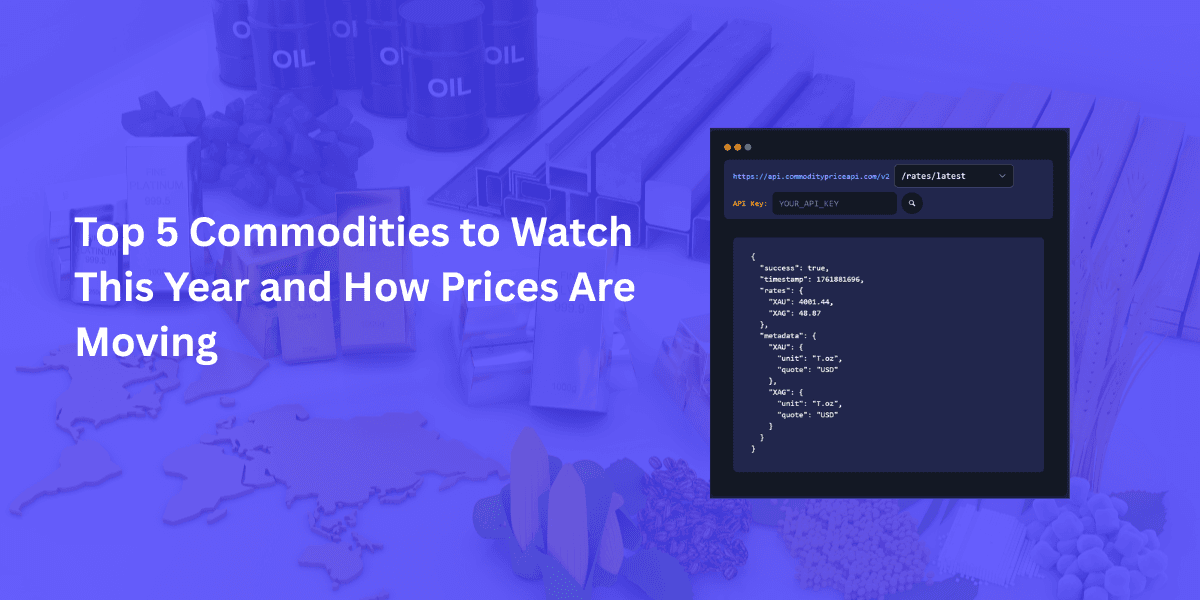
Top Commodities to Watch This Year and How Prices Are Moving
By
Ejaz Ahmed19 Dec 2025 • 7 min read
This is a prevalent thing that rising costs affect the top commodities and customers. Supply chains sometimes break, and investors struggle to predict commodity futures prices. The market moves very fast, creating constant uncertainty.
Tracking the prices of the most traded commodities has become essential over time. Real-time data is trending as it helps you make better decisions without wasting your time. Tools such as CommodityPriceAPI simplify this process and make monitoring easy. You can get instant updates and also historical trends via simple JSON endpoints.
In this blog, we will talk about the top commodities to watch this year. We will also talk about why prices are moving and what is essential for every market. You will see how to fetch real-time data and historical data. So let’s get started.
Why Commodity Prices Matter This Year
Markets are unstable, which is why most traded commodities prices matter a lot for this year. Inflation rises worldwide. Supply chains sometimes break, or break again and again. Energy demand keeps climbing.
Did you know what investors need? They need accurate and real-time pricing. So CommodityPriceAPI makes this easy, and you can easily fetch real-time and historical trends with endpoints such as:
/rates/latest?symbols=XAU,WTIOIL-FUTBecause of this, you instantly get gold and crude oil prices in real time.
Here is the sample response:
{
  "success": true,
  "timestamp": 1703866777,
  "rates": {
    "WTIOIL-FUT": 72.29,
    "XAU": 2066.98
  },
  "metaData": {
    "XAU": {
      "unit": "T.oz",
      "quote": "USD"
    },
    "WTIOIL-FUT": {
      "unit": "Bbl",
      "quote": "USD"
    }
  }
}
Learn about How To Forecast Commodity Futures Prices.
Top Commodities to Watch This Year
Gold (XAU)
Gold is a safe-haven asset, and central banks continue to buy it. Investors use it to protect themselves from economic and currency fluctuations.
Latest Sample Price
XAU: 4198.47 USD/T.oz
What Drives Movement
Economic concerns
Prices keep rising, which is why investors look for derivatives that hold value.
Forex fluctuation
Currencies will not always remain the same; they move up and down, which is suitable for investors because it pushes investors toward stable assets.
Interest rate expectations
Changing interest rates affect the demand for safe-haven assets such as gold.
How to Fetch Prices via API
/rates/latest?symbols=XAU&apiKey=YOUR_API_KEYHistorical Insight
/rates/historical?symbols=XAU&date=YYYY-MM-DDSample Response of Historical Data Endpoint:
{
  "success": true,
  "date": "2019-01-04",
  "rates": {
    "XAU": {
      "date": "2019-01-04",
      "open": 1295.17,
      "high": 1298.49,
      "low": 1276.6,
      "close": 1284.81
    },
    "WTIOIL-FUT": {
      "date": "2019-01-04",
      "open": 46.9,
      "high": 49.22,
      "low": 46.65,
      "close": 47.96
    },
    "TEAM": {
      "date": "2025-04-01",
      "open": 0,
      "high": 0,
      "low": 0,
      "close": 2.11
    }
  }
}
Crude Oil (WTI & Brent)
Oil affects the global inflation and also energy costs. Prices of crude oil change instantly in response to geopolitical and OPEC decisions. Some ETFs track oil and related commodities, giving traders exposure to energy markets.
Latest Sample Prices
WTI Oil (WTIOIL-FUT): 60.14 USD/BblBrent Oil (BRENTOIL-FUT): 63.75 USD/BblWhat Drives Movement
Middle East tensions
If there are conflicts in the regions, they often disrupt supply and drive up prices. This can gain attention from commodity group investors.
U.S. production levels
Higher or lower U.S. output changes global supply and also affects prices. Oil markets are often compared with copper, sugar, coffee, and livestock for diversified trading.
Global energy transition
The shift to cleaner energy affects long-term oil demand. Traders can leverage these trends using financial defined instruments to optimize positions.
API Endpoint Example
/rates/latest?symbols=WTIOIL-FUT, BRENTOIL-FUTTrack Fluctuations
/fluctuation?symbols=WTIOIL-FUT&startDate=2025-01-01&endDate=2025-01-31Silver (XAG)
Latest Sample Price
XAG: 58.36 USD/T.oz
Silver is essential for electronics, solar panels, and EV batteries. Clean-energy investment is increasing rapidly and in demand. China’s region also plays a key role in silver consumption.
What Drives Movement
Manufacturing growth
If the production increases and grows faster, then it increases the demand for silver. Investors follow benchmarks to track market changes.
Precious-metal sentiment
When an investor shows interest in silver and wants metal, then its price moves up. News about geopolitical tensions or war can also drive prices.
Mining supply
Limited and extracted supply can push prices up and down. Traders use CFDs to gain access to silver price movements.
API Request Example
/rates/latest?symbols=XAGNatural Gas (NG-FUT)
Latest Sample Price
NG-FUT: 5.29 USD/MMBtu
Natural gas powers these things, which are given below:
- Heating
- Industry
- Electricity
Seasonal spikes are widespread. Storage levels also make the market more volatile.
What Drives Movement
Weather patterns
It depends on the weather, because cold and hot weather can raise the demand and prices.
LNG exports
Shipping liquefied natural gas affects the global supply and prices.
Storage levels
Changes in low and high gas in storage affect the price.
Agricultural Staples (Corn, Wheat, Soybean)
Food inflation depends on the key staples. Climate change impacts global supply and energy prices. Brazil is a significant source of agricultural commodities.
Price Drivers
Weather shocks
Storms and droughts can cut share prices instantly.
Export bans
Restrictions on food exports reduce global supply, and prices rise, often driven by international policies.
Fertilizer costs
Higher fertilizer costs increase the farming costs and food prices, making production more expensive.
Fetch Real-Time Agri Prices
/rates/latest?symbols=CORN,WHEAT,SOYBEAN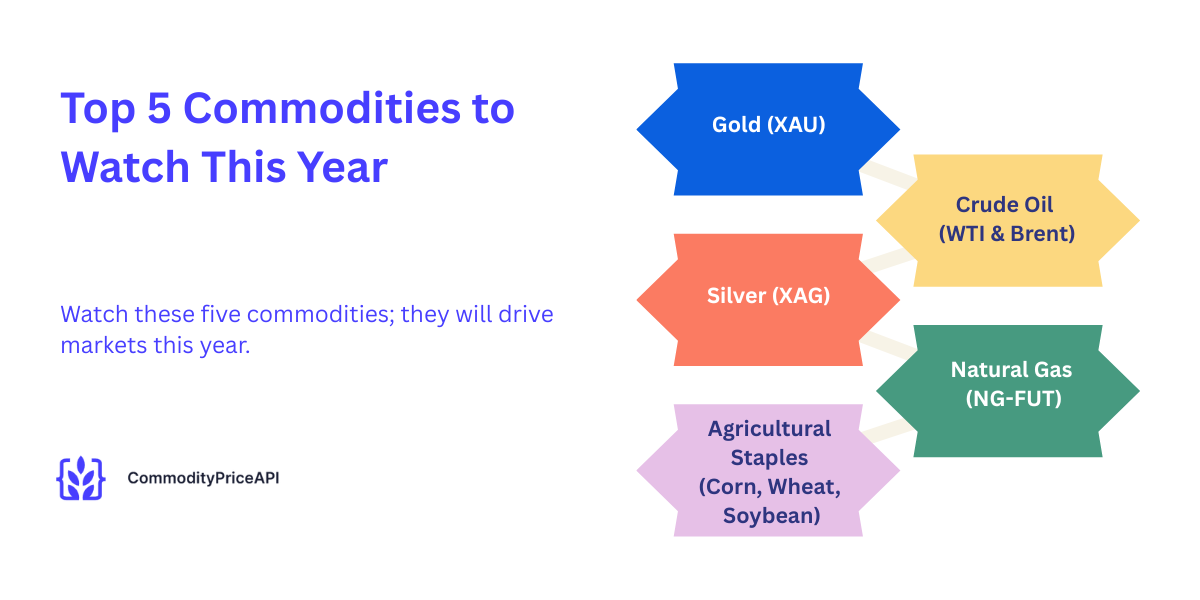
Commodity Prices Table
Commodity | Symbol | Latest Price | Unit | Primary Drivers |
Gold | XAU | 4198.47 USD | T.oz | Inflation, currency, and interest rates |
Silver | XAG | 58.36 USD | T.oz | Industry demand, mining supply |
WTI Crude Oil | WTIOIL-FUT | 60.14 USD | Bbl | Geopolitics, production, energy demand |
Brent Crude Oil | BRENTOIL-FUT | 63.75 USD | Bbl | Geopolitics, OPEC, energy transition |
Natural Gas | NG-FUT | 5.29 USD | MMBtu | Weather, exports, storage |
Corn | CORN | Variable | Bushel | Weather, fertilizer, export bans |
Wheat | WHEAT | Variable | Bushel | Weather, export bans |
Soybean | SOYBEAN | Variable | Bushel | Climate, global demand |
Commodity Prices Key Trends
- Precious metals are rising because of uncertainty. Investors follow the source for market updates.
- Oil is volatile due to supply risks, especially for WTI tracked in London and April futures.
- Natural gas prices change with the weather; its demand is high in winter.
- Agricultural commodities can change with climate patterns.
Using CommodityPriceAPI to Analyze Movements
Four primary endpoints help you:
- Real-time rates: /rates/latest
- Historical analysis: /rates/historical
- Daily fluctuations: /fluctuation
- Long-term trends: /timeseries
These four endpoints help you see and compare the trends and analyze the volatility. It builds dashboards and market tools.
Explore all the endpoints in this documentation.
How to Track Commodity Prices With CommodityPriceAPI
Fast and straightforward API Integration
- CommodityPriceAPI supports 130+ commodities.
- It gives you data in real-time & historical data.
- Only Plus and Premium users receive JSON responses updated every 60 seconds.
API Key Authentication
Authenticate via header: x-api-key: YOUR_API_KEY
Or query: ?apiKey=YOUR_API_KEY
Example: Fetching Multiple Commodity Prices
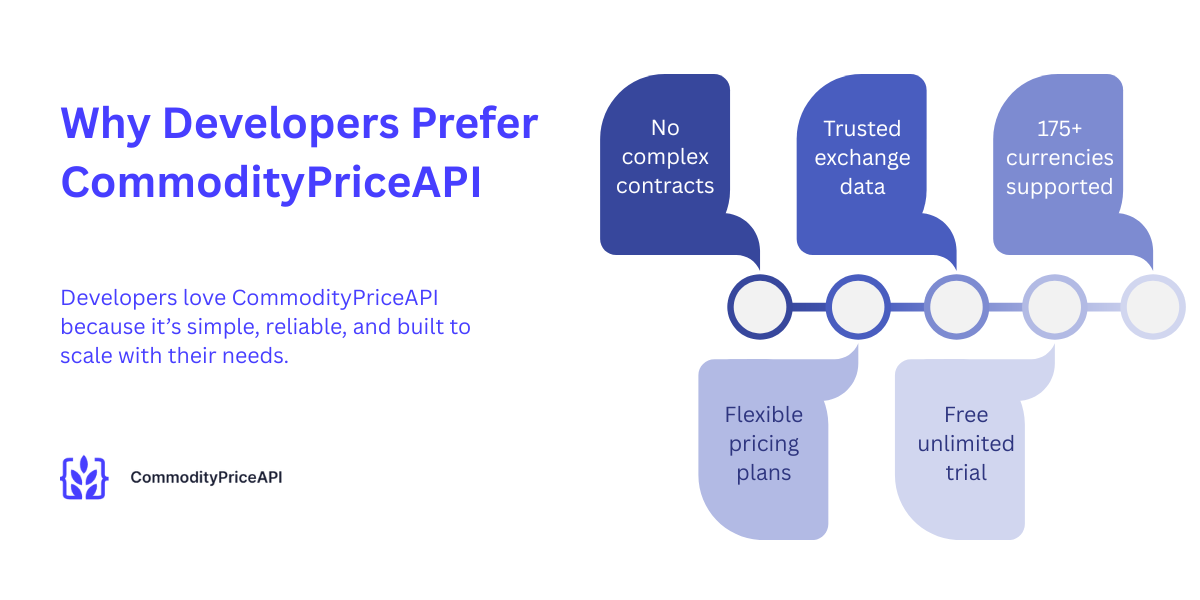
/rates/latest?symbols=XAU,XAG,WTIOIL-FUT,NG-FUTWhy Developers Prefer CommodityPriceAPI
- There are no complex contracts.
- Trusted exchange data for everyone.
- It supported 175+ currencies.
- It has flexible pricing plans.
- It gives you unlimited free trials.
TL;DR
This year, see the gold, silver, crude oil, natural gas, and key soft commodities very closely. Prices move very quickly due to inflation, climate change, energy demand, and geopolitical tensions. Precious metals act as a saven. Oil reacts to production and geographical events—natural gas spikes with seasonal demand. And last, soft commodities shift with the weather and with supply, making each one an underlying commodity.
Use CommodityPriceAPI to track real-time and historical prices very easily. It responds to simple JSON endpoints, so you can fetch multiple financial instruments and analyze trends. With it, you can integrate data into a dashboard. Without manual tracking, traders, analysts, and developers make informed decisions. Real-time updates and historical data keep you ahead in the volatile market.
Conclusion
Commodity markets are very active and unpredictable. Gold and silver give you the safe-haven stability, mainly when you track spot gold. On the other hand, crude oil, such as West Texas Intermediate, responds to geopolitical developments and production shifts. Natural gas spikes seasonally, and corn, wheat, and soybeans react to climate and supply conditions, making them key agricultural products.
Accurate data is critical. CommodityPriceAPI gives you both real-time and historical prices. It also gives fluctuating spot price information for over 130 raw materials. You can easily integrate with JSON endpoints into applications, dashboards, and analytics tools.
Real-time tracking is invaluable for investors because it helps hedge risks, enables traders to plan strategies, and enables businesses to forecast costs effectively and efficiently. When you monitor these key markets, you will respond more quickly to market changes. You can optimize changes and stay ahead of global trends. The correct data makes decision-making confident and effective for your portfolio.
FAQs
Which Commodity Is the Most Important to Watch This Year?
Gold and oil lead the market because of inflation and geopolitical risks.
How Can I Track And Note Real-Time Commodity Prices?
For this, use/rates/latest for the instant JSON response.
Can I See Historical Prices for Gold or Oil?
Yes, for this use the /rates/historical endpoint with a date parameter.
How Often Do Prices Update?
Lite plan: prices update every 10 minutes; Plus and Premium plans: get updates every 60 seconds.
Do I Need a Credit Card to Get an API Key?
No, for the free trial, no credit card is required. When you log in, you will get your API key instantly.
Which Commodities Does the API Support?
There are 130+ options; it also includes the things given below.
- Metals
- Energy
- Agriculture
Can I Fetch Prices in My Local Currency?
Yes, Premium and plans support 175+ currencies.
How Far Back Does Historical Data Go?
It provides data from the 1990s for some commodities.
How Do I Monitor Price Fluctuations?
Use the /fluctuation endpoint with start and end dates for futures contracts.
Can I Use the API in a Commercial Application?
Yes. All paid plans allow commercial usage.