Gold Price API: Build a Real-Time Gold Price Dashboard with Python (2026 Guide)
By
Ejaz Ahmed17 Mar 2026 • 10 min read

Developers creating finance dashboards, trading applications, or analytics platforms may require real-time, precise gold price data. A Gold Price API provides reliable market prices via a simple JSON response. Instead of scraping websites or running complicated data streams.
In this blog post, we will explain how to create a real-time gold price dashboard with Python and the CommodityPriceAPI. We will retrieve real-time gold prices, manipulate the information, and present it in a basic dashboard.
Let's begin and fetch accurate data.
Technical Implementation: Building the Dashboard
Our dashboard will be developed using Python.
CommodityPriceAPI will be used because it offers a free trial of the gold price API and supports over 130 assets. High-frequency JSON data is available from the CommodityPriceAPI, with updates every 60 seconds.
Prerequisites
- Python is installed on your computer.
- A free API key of CommodityPriceAPI.
- The requests library to process the api calls.
Step 1: Fetching the Current Gold Spot Price Using CommodityPriceAPI
To get the current gold price, we shall validate the latest rates endpoint of the CommodityPriceAPI.
API Endpoint
https://api.commoditypriceapi.com/v2/rates/latestPython Example
import requests
api_key = "YOUR_API_KEY" # Replace with your free or paid API key
symbol = "XAU" # XAU is the symbol for gold
url = f"https://api.commoditypriceapi.com/v2/rates/latest?apiKey={api_key}&symbols={symbol}"
response = requests.get(url)
data = response.json()
if data['success']:
gold_price = data['rates']['XAU'] # Extract price in USD per troy ounce
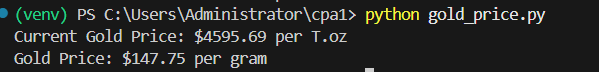
print(f"Current Gold Price: ${gold_price} per T.oz")
else:
print("Error fetching data:", data.get('error', 'Unknown error'))Example API Response
{
  "success": true,
  "rates": {
    "XAU": 5217.49
  },
  "metadata": {
    "XAU": {
      "unit": "T.oz",
      "quote": "USD"
    }
  }
}
Here is the output inside the terminal:

Explanation
- To authenticate your requests, use apiKey.
- A commodity is defined by symbols (such as XAU, which stands for gold).
- Rates ["XAU"] provide the current price of gold.
- Metadata includes the unit (T.oz) and the quote currency (USD).
- The JSON error field helps handle errors.
Pro Tip:
- Prices may be quoted in other currencies, e.g., quote=INR, which can be an optional quote parameter.
- Environment variables are where your API key should be placed, not in the open code.
Step 2: Handling Different Units and Currencies
CommodityPriceAPI will enable you to access gold prices in other currencies and exchange rates in your dashboard. The international user creating global financial dashboards needs support for many fiat currencies and various units (e.g., Ounce, Gram, Kilo).
Converting Units (T.oz → grams)
The API offers live metal prices in kilograms, grams, and troy oz. This simplifies the construction of dashboards and the availability of a variety of units.
# 1 troy ounce = 31.1035 grams
troy_ounce_to_grams = 31.1035

gold_price_per_toz = data['rates']['XAU']
gold_price_per_gram = gold_price_per_toz / troy_ounce_to_grams

print(f"Gold Price: ${gold_price_per_gram:.2f} per gram")
Here is the output shown inside the terminal:
Fetching Gold Prices in a Different Currency
You can give an optional quote parameter to give prices in the desired currency, e.g., INR or EUR:
quote_currency = "INR"
url = f"https://api.commoditypriceapi.com/v2/rates/latest?apiKey={api_key}&symbols={symbol}"e={quote_currency}"
response = requests.get(url)
data = response.json()
if data['success']:
gold_price_inr = data['rates']['XAU']
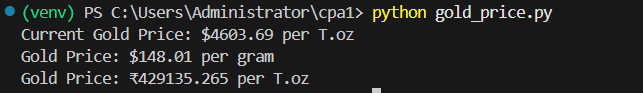
print(f"Gold Price: ₹{gold_price_inr} per T.oz")
else:
print("Error fetching data:", data.get('error', 'Unknown error'))Here is the output we get:
Explanation
- A quote will help you display prices in 175+ supported currencies.
- The dashboard can be customized, allowing your Python script to perform unit conversions.
- It allows developers to present local prices to users in other nations.
Pro Tip:
- When you need a dynamic conversion, always obtain the current exchange rates.
- Install unit conversion in the quote so you can add units and currencies, then use them simultaneously on your dashboard.
Step 3: Visualizing With a Gold Price Chart API
The /timeseries endpoint can be used to retrieve historical gold prices and generate a price chart. Gold price data is often used in academic analysis and economic modeling.
import requests
import matplotlib.pyplot as plt
from datetime import datetime, timedelta
api_key = "add-your-api-key"
symbol = "XAU"
end_date = datetime.today()
start_date = end_date - timedelta(days=30)
# ✅ FIXED ENDPOINT
url = f"https://api.commoditypriceapi.com/v2/rates/time-series?apiKey={api_key}&symbols={symbol}&startDate={start_date.strftime('%Y-%m-%d')}&endDate={end_date.strftime('%Y-%m-%d')}"
response = requests.get(url)
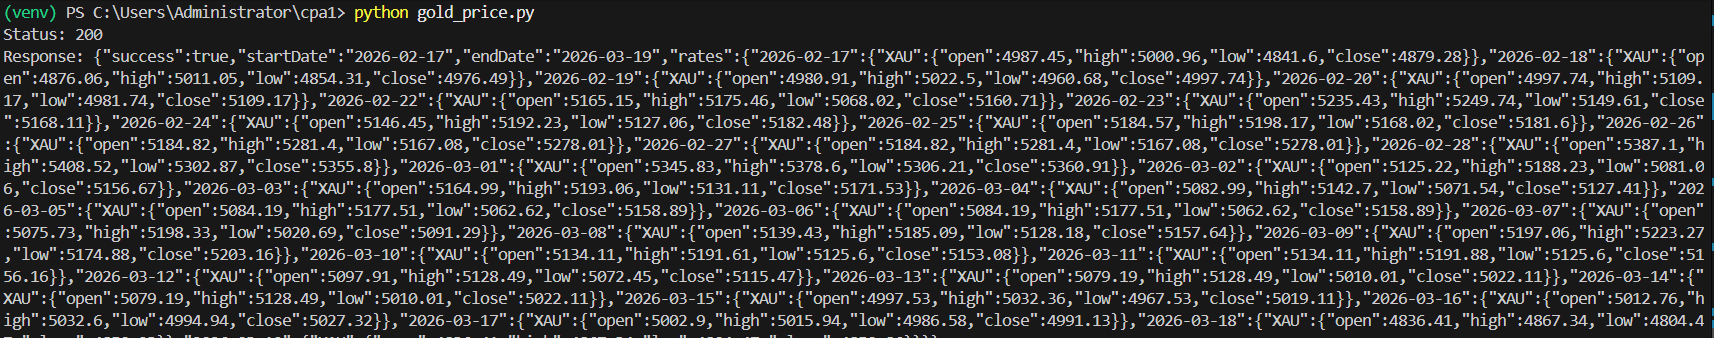
print("Status:", response.status_code)
print("Response:", response.text)
data = response.json()
if data.get('success'):
dates = []
prices = []
for date_str, daily_data in data['rates'].items():
dates.append(datetime.strptime(date_str, "%Y-%m-%d"))
prices.append(daily_data[symbol]['close'])
plt.figure(figsize=(10,5))
plt.plot(dates, prices, marker='o')
plt.title("Gold Price - Last 30 Days")
plt.xlabel("Date")
plt.ylabel("Price in USD per T.oz")
plt.xticks(rotation=45)
plt.grid(True)
plt.tight_layout()
plt.show()
else:
print("Error:", data)Terminal Output:
Explanation
- The historical range (max 1 year per request) is defined by startDate and endDate.
- Rate_info['close'] provides the closing price of each day.
- Investing.com also provides historical gold price data, along with technical analysis indicators.
- A simple, readable chart is plotted on your dashboard using matplotlib.
Pro Tip:
- Candlestick or OHLC(Many APIs provide historical gold prices data in OHLCV format) plots can be customized. It suits your requirements if you need more elaborate financial representation. Access to Open, High, Low, and Close prices is necessary for technical analysis.
- The quote parameter should be used if you require prices in alternative currencies.
Helpful Resource: Best Free API For Commodity Prices (Real-Time & Historical Data)
Mini Python Dashboard Working Code Example
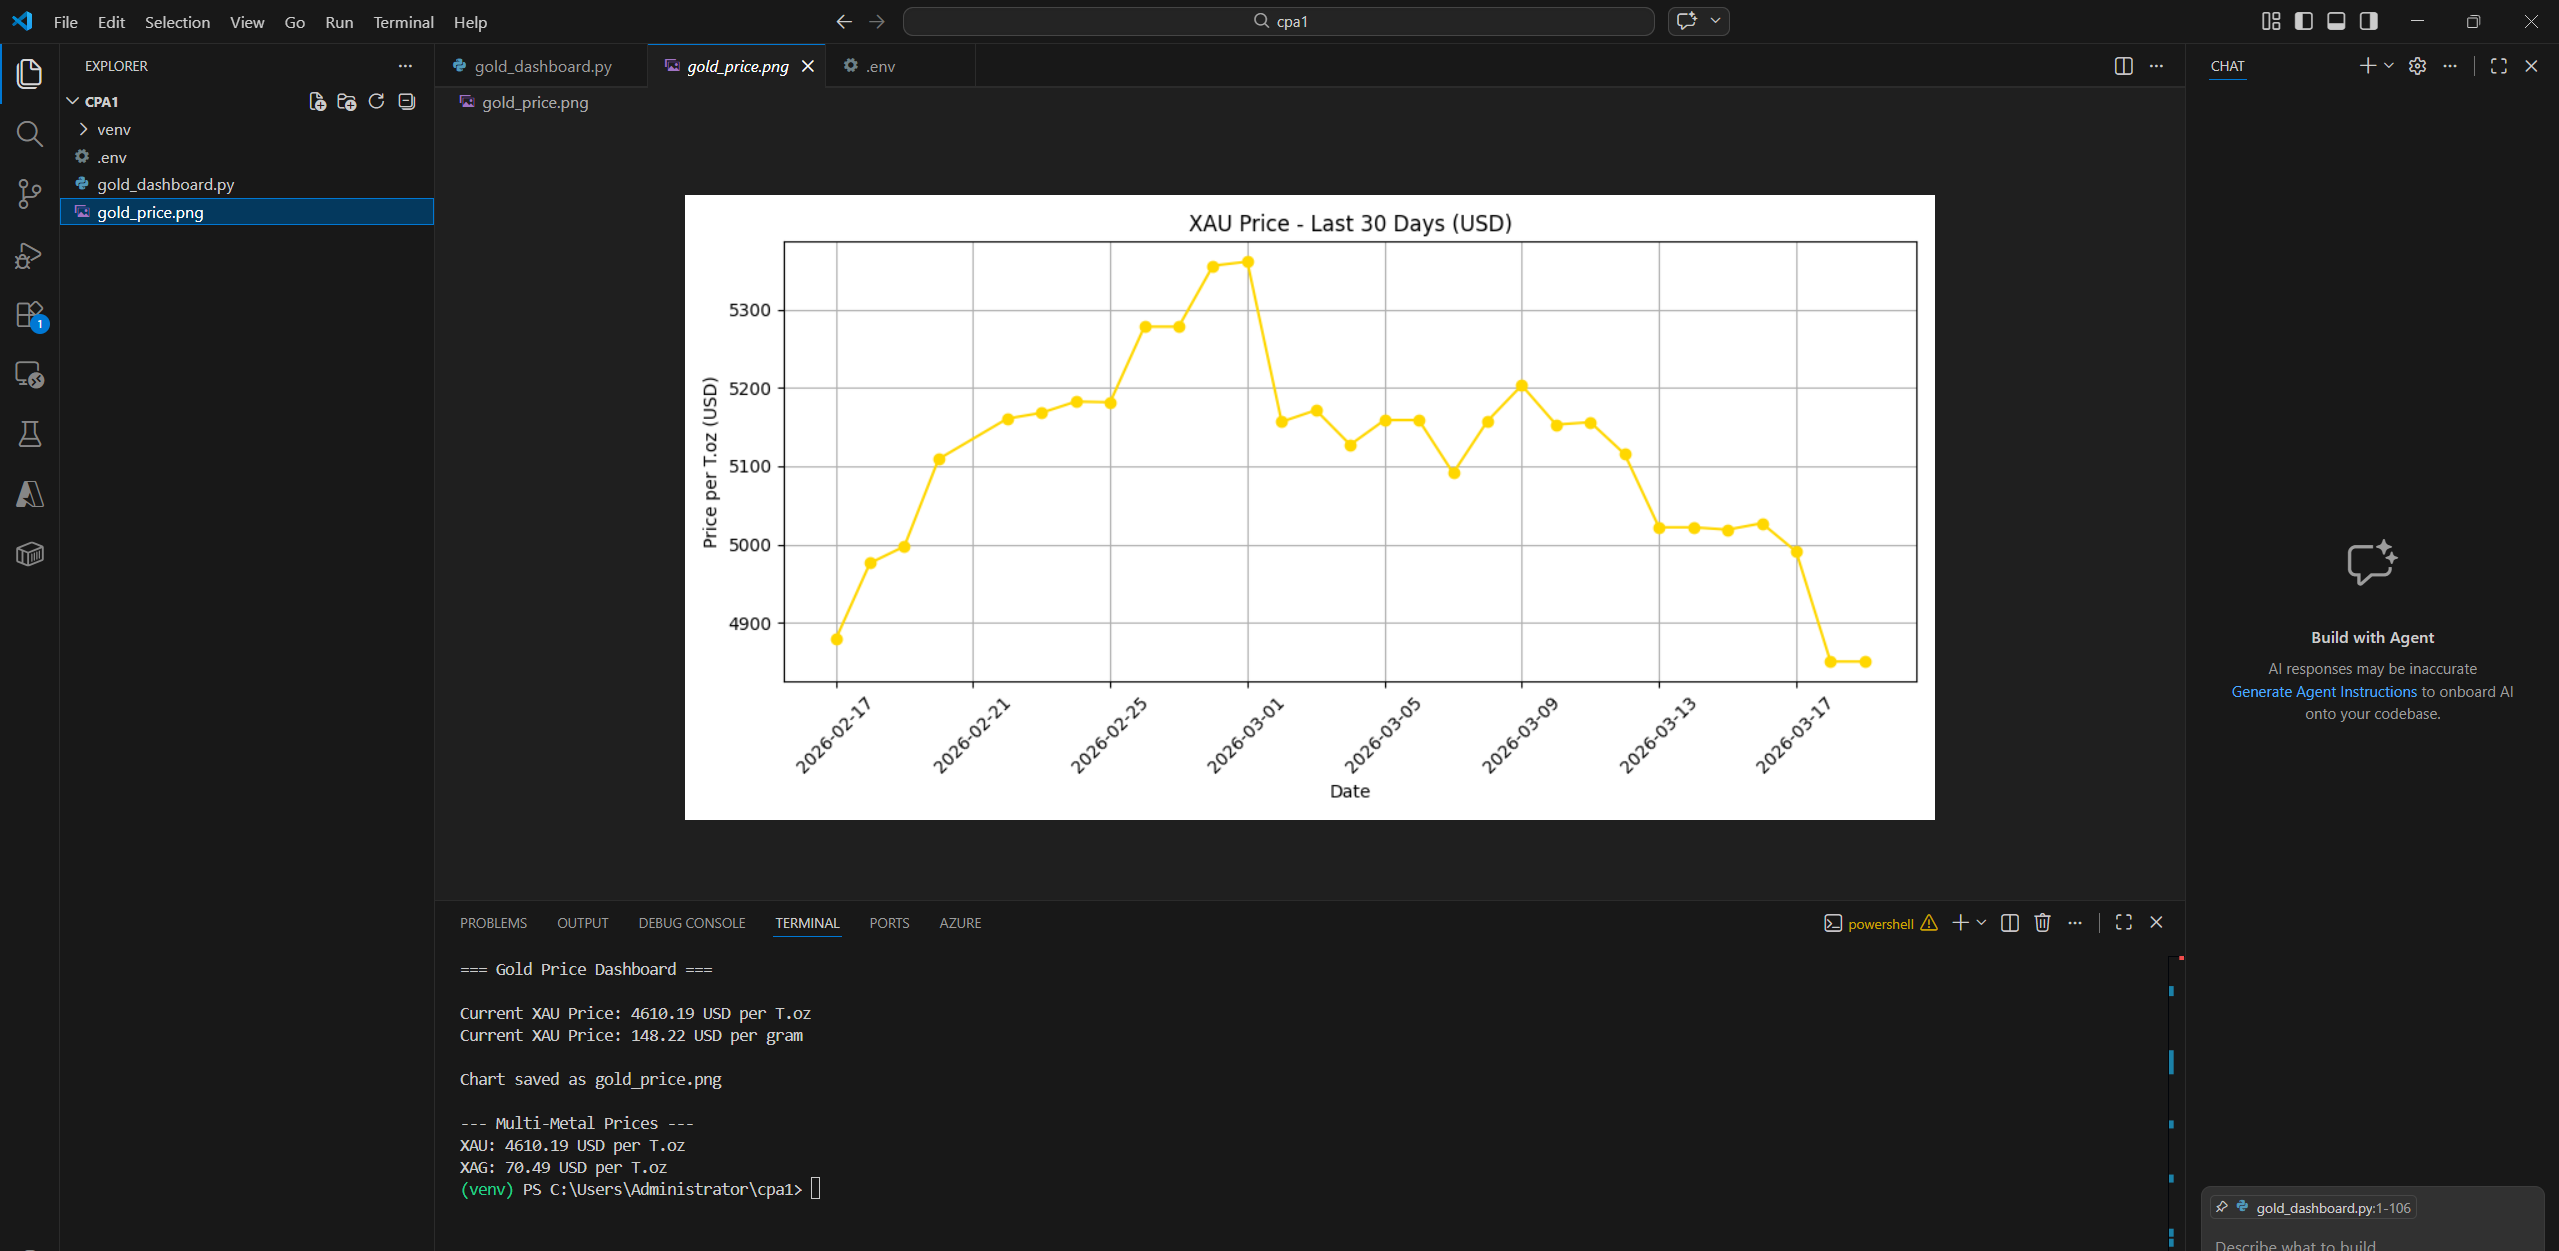
When we combine all the above functionalities into a single file, we get a basic Python visualization dashboard. A PNG file is also saved inside our folder.
# gold_dashboard.py
import os
import requests
import matplotlib
matplotlib.use("Agg") # Non-GUI backend
import matplotlib.pyplot as plt
from datetime import datetime, timedelta
from dotenv import load_dotenv
# Load API key
load_dotenv()
api_key = os.getenv("API_KEY")
if not api_key:
raise ValueError("Please set your API_KEY in a .env file")
symbol = "XAU" # Gold
quote_currency = "USD" # Change to INR, EUR, etc.
troy_ounce_to_grams = 31.1035
# ----------------------------
# Fetch latest gold price
# ----------------------------
def fetch_latest_price(symbol="XAU", quote="USD"):
url = f"https://api.commoditypriceapi.com/v2/rates/latest?apiKey={api_key}&symbols={symbol}"e={quote}"
response = requests.get(url)
data = response.json()
if data.get("success"):
return data['rates'][symbol]
else:
print("Error fetching latest price:", data.get('error', 'Unknown'))
return None
# ----------------------------
# Convert T.oz → grams
# ----------------------------
def to_grams(price_per_toz):
return price_per_toz / troy_ounce_to_grams
# ----------------------------
# Fetch historical prices
# ----------------------------
def fetch_historical_prices(symbol="XAU", quote="USD", days=30):
end_date = datetime.today()
start_date = end_date - timedelta(days=days)
url = (
f"https://api.commoditypriceapi.com/v2/rates/time-series?"
f"apiKey={api_key}&symbols={symbol}"e={quote}"
f"&startDate={start_date.strftime('%Y-%m-%d')}"
f"&endDate={end_date.strftime('%Y-%m-%d')}"
)
response = requests.get(url)
data = response.json()
if data.get("success"):
dates, prices = [], []
for date_str, daily_data in sorted(data['rates'].items()):
dates.append(datetime.strptime(date_str, "%Y-%m-%d"))
prices.append(daily_data[symbol]['close'])
return dates, prices
else:
print("Error fetching historical data:", data)
return [], []
# ----------------------------
# Plot historical chart
# ----------------------------
def plot_historical_chart(dates, prices, symbol="XAU", quote="USD", filename="gold_price.png"):
plt.figure(figsize=(10,5))
plt.plot(dates, prices, marker='o', linestyle='-', color='gold')
plt.title(f"{symbol} Price - Last {len(dates)} Days ({quote})")
plt.xlabel("Date")
plt.ylabel(f"Price per T.oz ({quote})")
plt.xticks(rotation=45)
plt.grid(True)
plt.tight_layout()
plt.savefig(filename)
print(f"Chart saved as {filename}")
# ----------------------------
# Main Dashboard
# ----------------------------
if __name__ == "__main__":
print("=== Gold Price Dashboard ===\n")
# Latest price
price_toz = fetch_latest_price(symbol, quote_currency)
if price_toz:
price_gram = to_grams(price_toz)
print(f"Current {symbol} Price: {price_toz:.2f} {quote_currency} per T.oz")
print(f"Current {symbol} Price: {price_gram:.2f} {quote_currency} per gram\n")
# Historical chart
dates, prices = fetch_historical_prices(symbol, quote_currency)
if dates and prices:
plot_historical_chart(dates, prices, symbol, quote_currency)
# Multi-metal prices
metals = ["XAU","XAG","XPT","XPD"]
url = f"https://api.commoditypriceapi.com/v2/rates/latest?apiKey={api_key}&symbols={','.join(metals)}"e={quote_currency}"
data = requests.get(url).json()
if data.get("success"):
print("\n--- Multi-Metal Prices ---")
for metal, price in data['rates'].items():
print(f"{metal}: {price:.2f} {quote_currency} per T.oz")
else:
print("Error fetching multi-metal prices:", data.get('error', 'Unknown'))Here is the output:
Advanced Features: More Than Just Gold
It is not only gold that can be monitored on your dashboard. CommodityPriceAPI also allows tracking silver (XAG), platinum (XPT), palladium (XPD), and industrial metals, in addition to gold.
Example: Fetch Real-Time Prices for Multiple Metals
import requests
api_key = "YOUR_FREE_API_KEY"
symbols = "XAU,XAG,XPT,XPD" # Gold, Silver, Platinum, Palladium
quote_currency = "USD"
url = f"https://api.commoditypriceapi.com/v2/rates/latest?apiKey={api_key}&symbols={symbols}"e={quote_currency}"
response = requests.get(url)
data = response.json()
if data['success']:
for metal, info in data['rates'].items():
print(f"{metal}: {info} {data['metaData'][metal]['quote']} per {data['metaData'][metal]['unit']}")
else:
print("Error fetching data:", data.get('error', 'Unknown error'))Using Timeseries for Historical Comparisons
- Able to retrieve daily historical prices of different metals:
import requests
from datetime import datetime, timedelta

api_key = "YOUR_FREE_API_KEY"
symbols = "XAU,XAG"
start_date = (datetime.today() - timedelta(days=30)).strftime('%Y-%m-%d')
end_date = datetime.today().strftime('%Y-%m-%d')

url = f"https://api.commoditypriceapi.com/v2/timeseries?apiKey={api_key}&symbols={symbols}&startDate={start_date}&endDate={end_date}"

data = requests.get(url).json()
print(data)
Track Fluctuation Between Two Dates
- Display changes over a time interval using /fluctuation endpoint:
url = f"https://api.commoditypriceapi.com/v2/fluctuation?apiKey={api_key}&symbols={symbols}&startDate={start_date}&endDate={end_date}"
data = requests.get(url).json()
print(data['rates'])
Custom Quote Currencies
- Quote your prices in 175+ supported currencies:
quote_currency = "INR"  # Convert prices to Indian Rupees
# Add quote={quote_currency} in the latest rates or timeseries endpoint
Benefits:
- Compare the trends of metals.
- Make informed trading or investment.
- Provide multi-metal dashboards in your application with a custom currency option.
Technical Note: Securely Storing Your API Key
Always keep your CommodityPriceAPI key out of your scripts. Leaking it to a public repository or client-side applications can expose your account. Rather, rely on environment variables or secure configuration files.
Using a .env File (Python Example)
- Install python-dotenv:
pip install python-dotenv- Create a .env file:
API_KEY=your_commoditypriceapi_key- Load the key in Python:
import os
from dotenv import load_dotenv

load_dotenv()  # Load environment variables from .env
api_key = os.getenv("API_KEY")

print(f"Using API key: {api_key[:4]}****")  # Only show partial key for safety
Best Practices:
- Do not put .env in version control (.gitignore).
- In the case of production apps, one could look at such secret managers as AWS Secrets Manager, GCP Secret Manager, or Azure Key Vault.
- Never log your full API key.
Why it Matters:
Secure key storage helps your account by keeping it out of unauthorized hands. It helps keep your service running and build trust during the times when your app handles financial data.
Helpful Resource: Why Every Business Needs Live Commodity Data Now
Security and Data Reliability in Gold Price API Integration
Security is an important consideration when choosing a gold price API. High-value, sensitive transactions are carried out daily in financial applications. The lack of strong security may harm trust and lead to severe financial losses.
Consistent storage and environment variables can help you always keep your API key secure. Always hide keys in any open repositories and mobile applications. This prevents maltreatment, embezzlement, and service breakdown.
Real-time financial systems also require reliable data. False gold prices from a gold price api or Kitco Gold Price API may confuse users and affect their trading decisions. Trustworthy sources increase customer reliability and retention.
The main characteristics of reliability to consider include the following:
- Adequate uptime and stability.
- Free sources of valid information, e.g., LBMA and international exchanges.
- Fast response time and frequent updates.
A stable, secure API enables it to be scaled and expanded into foreign markets. It reduces operational risk and increases business continuity. This makes your dashboard efficient in the fluctuating markets.
Helpful Resource: Gold Prices Data: Top 10 Reliable Sources You Must Try
TL;DR
- What: CommodityPriceAPI provides real-time and historical gold price information via an easy-to-use JSON response. It promotes more than 130 commodities.
- Why: Developers can receive the right precious metals prices in real-time without the need to manually track or establish complicated pipelines (which require complicated data pipelines).
- How: Python (or any other programming language) is used to get data using REST API endpoints, /rates/latest to get the latest rates, /historical to get past rates, or /time series to get trends.
- Free Trial: Use Free Trial to test your integration on CommodityPriceAPI using the unlimited free trial - no credit card needed.
- Storage: Keep your API key secret (in environment variables or a secret manager) and select a subscription plan based on the number of API calls you intend to make.
- Advanced: The API allows customization of prices in 175+ currencies, trend visualization, and daily fluctuations using API endpoints.
Conclusion
Creating a live tracking gold dashboard is a vital skill in the modern world. It enables financial developers to remain relevant in rapid markets. This competency also enhances your technical and product capabilities.
You create good customer value through a real-time gold price API. Users obtain real-time insights rather than delayed information. This builds confidence and leads to better financial decisions.
This helps you shift assumptions to timely, accurate gold insights. A gold price API supports faster responses and smarter trading. It is also used to mitigate risk in volatile markets.
FAQs
Is There A Free Gold Price API For Developers?
Yes! The CommodityPriceAPI would offer a free, unlimited trial for integrations. To test real-time and historical data, you can have a free API key without a credit card.
How Often Is The Gold Data Updated?
- Lite plan: every 10 minutes
- Plus / Premium plans: every 60 seconds (real-time)
- Real-time prices are available at /rates/latest endpoint.
Can I Access Historical Gold Price Data?
Absolutely. CommodityPriceAPI provides historical data dating back to January 1, 1990, with 60-second updates via the /historical or /timeseries endpoints. This is best suited to trend analysis and chart creation.
What Units Does The Gold Spot Price API Use?
The default unit is Troy ounce (T.oz). The API has a custom quote parameter that allows you to convert prices to grams, kilograms, and other currencies.
How Can I Secure My API Key?
- Do not use keys in client-side code or in open repositories.
- Use secret managers or environment variables.
- Share keys in server-side connections only.
What Are The Rate Limits?
- Lite plan: 2,000 API calls per month
- Plus plan: 10,000 calls
- Premium plan: 50,000 calls
Make sure your integration does not exceed rate limits when LIMIT_REACHED errors occur.
Can I Change The Quote Currency For Gold Prices?
Yes! CommodityPriceAPI is applicable to 175+ currencies. Include the quote parameter in your API request and get prices in your favorite currency.