How to Build a Scalable Gold Analytics SaaS Using a Gold API (2026 Full Code Tutorial)
By
Ejaz Ahmed17 Mar 2026 • 9 min read

Using a Gold API, you can get access to real-time and historical precious metals data and transform it into actionable data. This guide provides an in-depth code tutorial, step-by-step integration, and much more.
We will discuss how a gold API can also provide precious metals prices and the types of data you can access. Next, we will show you a complete code example of gold API integration within a full-stack SaaS app.
This will be a tutorial on how to integrate a commodity prices API into a backend and display the results on the frontend. Furthermore, you will also learn about:
- Monetization Strategies for Gold Analytics SaaS
- Error Handling and Reliability Best Practices
- Marketing and Growth Strategy
- Choosing the Best Gold API in 2026: Free & Paid Options
- Comparison of Gold API Features
- Final Thoughts: Build Your Gold SaaS With a Reliable Gold API
Let's get started.
Why Do You Need a Gold API for Building SaaS?
A gold API helps you fetch accurate gold prices from reliable data sources. However, you should know that APIs like commoditypricesAPI can provide access to gold prices and other commodities. This information includes gold, silver, platinum, and palladium prices and trading volume.
Businesses now track prices using gold price APIs instead of manual methods. Third-party APIs are faster and more cost-effective than building in-house data feeds. The reason is simple. These APIs fetch data from reliable sources. For example, CommodityPricesAPI fetches its data from trusted exchanges and financial institutions.
Gold APIs give a better user experience to your apps. This is because apps depend on real-time data, and APIs can provide it instantly.
Investors can make money decisions in line with real-time trends and demand. This gives users more confidence in your solutions. This trust directly relates to customer retention and revenue.
Helpful Resource: Why Every Business Needs Live Commodity Data Now
The API Supports More Than Just Gold Prices
With APIs like CommodityPricesAPI, you get more than just gold prices. It gives you access to multiple commodities data including:
Supported Commodities Include:
Precious Metals
- Gold (XAU)
- Silver (XAG)
Energy Commodities
- WTI Crude Oil (WTIOIL-FUT)
- Brent Crude Oil (BRENTOIL-FUT)
- Natural Gas (NG-FUT)
Agricultural Commodities
- Corn
- Wheat
- Soybeans
Since the API supports over 130 commodities and 175 quote currencies, developers can create global commodity dashboards, trading applications, and fintech analytics applications with one data source.
This is particularly convenient with applications that must:
- Follow various markets simultaneously.
- Compare the performance of commodities.
- Construct a diversified investment dashboard.
Let's try integrating the commodity prices API within a full-stack SaaS app:
Step-by-Step Gold API Integration Tutorial for Beginners
Step 1: Set up Your Environment
Tools You’ll Need:
- Node.js (or Python, but we will work with Node.js because it is simple)
- NPM, known as Node Package Manager
- Code editor, VS Code is recommended.
- Browser
Steps:
- Install Node.js from nodejs.org.
- Create a new folder for your project:
mkdir gold-saas
cd gold-saas- Initialize Node.js project:
npm init -y- To make an API request, install Axios:
npm install axiosStep 2: Get Your Gold API Key
- Register for a CommodityPriceAPI account and get access to your dashboard.
- Now, copy the API key, but keep it secret.
- Store the secret key in an environment file .env. Create this file in your project:
API_KEY=YOUR_SECRET_KEYNote: Never expose your API key in frontend code. Always store it in environment variables or backend services.
Step 3: Fetch Live & Historical Gold Prices
Create a file server.js:
require('dotenv').config();
const express = require('express');
const axios = require('axios');
const cors = require('cors');
const app = express();
const PORT = 3000;
app.use(cors());
const API_KEY = process.env.API_KEY;
const BASE_URL = 'https://api.commoditypriceapi.com/v2/rates';
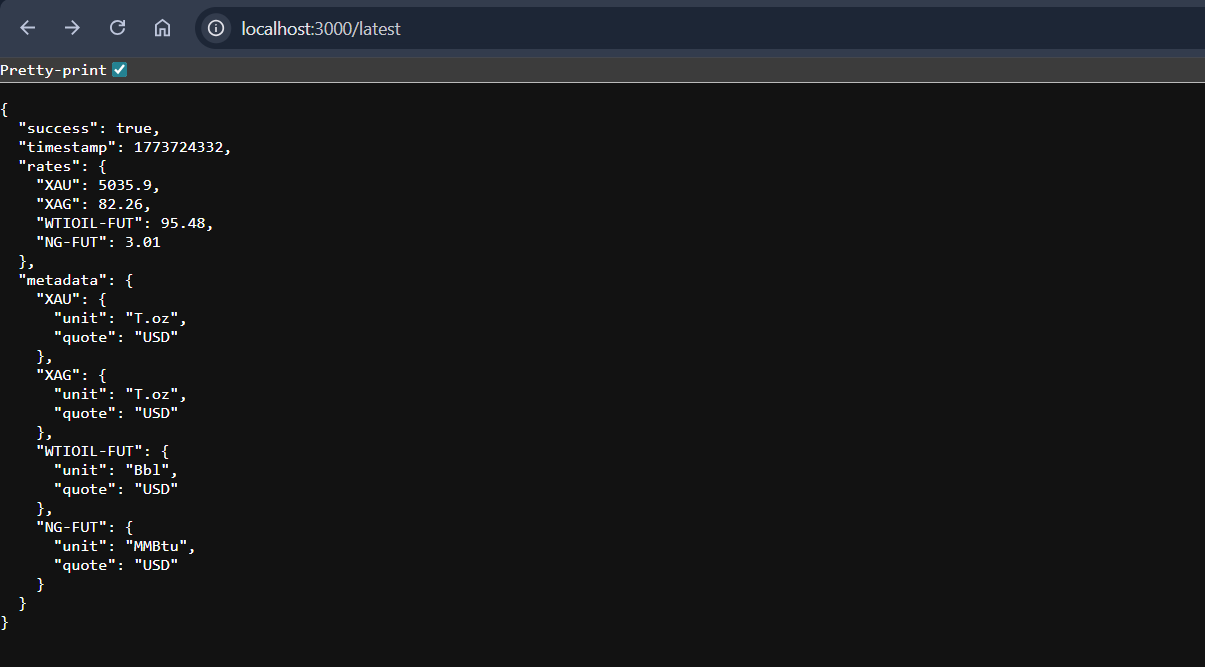
// 1. Latest Price
app.get('/latest', async (req, res) => {
try {
const response = await axios.get(`${BASE_URL}/latest`, {
params: { apiKey: API_KEY, symbols: 'XAU' }
});
// API returns a number directly for XAU in latest
const price = response.data.rates.XAU;
res.json({ success: true, price: price });
} catch (error) {
res.status(500).json({ success: false, error: error.message });
}
});
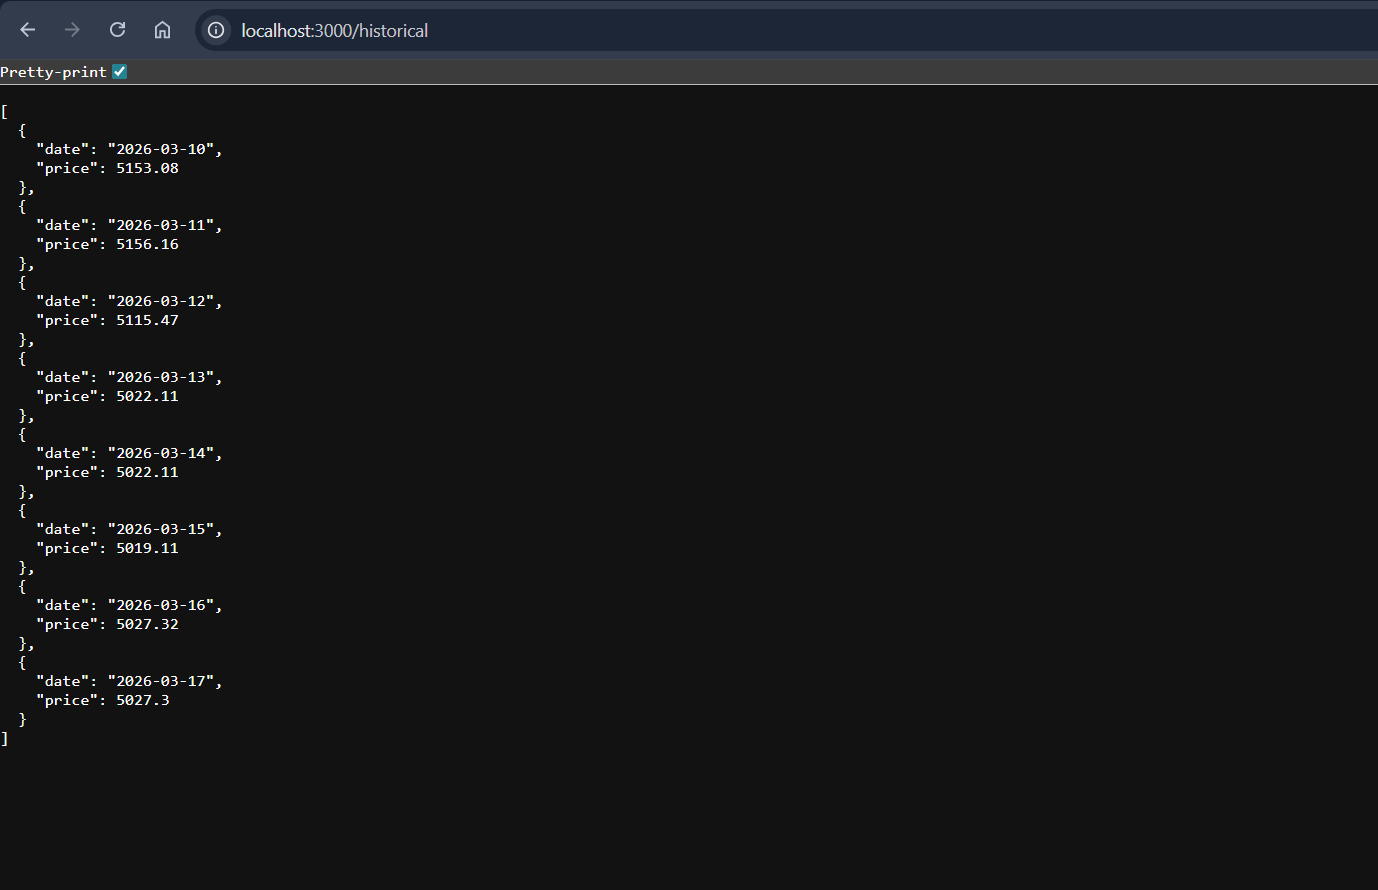
// 2. Historical (Fixed to handle the API's object response)
app.get('/historical', async (req, res) => {
try {
const history = [];
const today = new Date();
for (let i = 7; i >= 0; i--) {
const d = new Date();
d.setDate(today.getDate() - i);
const fmtDate = d.toISOString().split('T')[0];
const response = await axios.get(`${BASE_URL}/historical`, {
params: { apiKey: API_KEY, symbols: 'XAU', date: fmtDate }
});
if (response.data.success) {
const data = response.data.rates.XAU;
// Docs show historical returns an object { open, high, low, close }
const price = (typeof data === 'object') ? data.close : data;
history.push({ date: fmtDate, price: price });
}
}
res.json(history);
} catch (error) {
res.json([]); // Return empty array on fail to prevent frontend crash
}
});
app.listen(PORT, () => console.log(`Backend: http://localhost:${PORT}`));Run the file:
node server.jsLive & historical gold prices should be displayed with a time stamp.
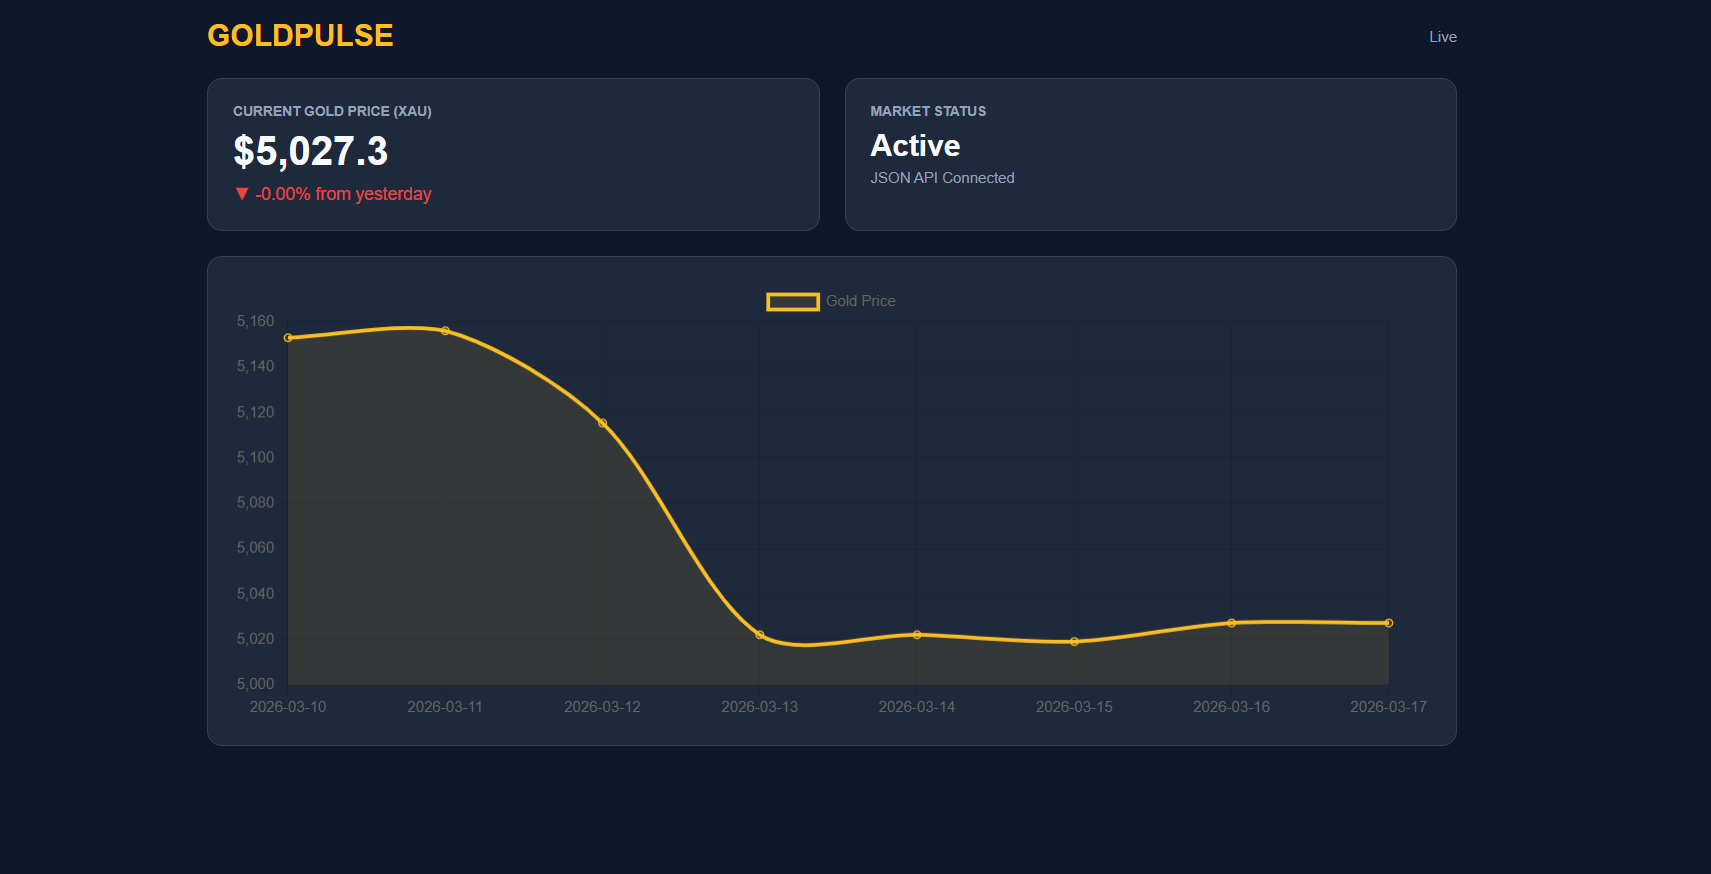
Step 4: Build a Simple Dashboard
To show live gold prices, we will use HTML + Chart.js:
- Create index.html:
<!DOCTYPE html>
<html lang="en">
<head>
    <meta charset="UTF-8">
    <title>GoldPulse | Dashboard</title>
    <script src="https://cdn.jsdelivr.net/npm/chart.js"></script>
    <style>
        :root { --bg: #0f172a; --card: #1e293b; --accent: #fbbf24; --text: #f8fafc; --up: #10b981; --down: #ef4444; }
        body { font-family: sans-serif; background: var(--bg); color: var(--text); padding: 20px; margin: 0; }
        .container { max-width: 1000px; margin: auto; }
        header { display: flex; justify-content: space-between; align-items: center; margin-bottom: 20px; }
        .grid { display: grid; grid-template-columns: 1fr 1fr; gap: 20px; margin-bottom: 20px; }
        .card { background: var(--card); padding: 20px; border-radius: 12px; border: 1px solid #334155; }
        .label { color: #94a3b8; font-size: 11px; text-transform: uppercase; margin-bottom: 8px; font-weight: bold; }
        .value { font-size: 32px; font-weight: bold; }
        .chart-box { background: var(--card); padding: 20px; border-radius: 12px; height: 350px; border: 1px solid #334155; }
    </style>
</head>
<body>
    <div class="container">
        <header>
            <h1 style="color:var(--accent); margin:0; font-size: 24px;">GOLDPULSE</h1>
            <div id="status" style="font-size:12px; color:#94a3b8;">Initialising...</div>
        </header>

        <div class="grid">
            <div class="card">
                <div class="label">Current Gold Price (XAU)</div>
                <div id="price-card" class="value">$--</div>
                <div id="trend-card" style="margin-top:8px; font-size:14px;">--</div>
            </div>
            <div class="card">
                <div class="label">Market Status</div>
                <div class="value" style="font-size:24px;">Active</div>
                <div style="color:#94a3b8; font-size:12px; margin-top:5px;">JSON API Connected</div>
            </div>
        </div>

        <div class="chart-box">
            <canvas id="goldChart"></canvas>
        </div>
    </div>

    <script>
        async function runDashboard() {
            try {
                // 1. Get History & Build Chart (The part that works)
                const hRes = await fetch('http://localhost:3000/historical');
                const history = await hRes.json();

                if (history.length > 0) {
                    new Chart(document.getElementById('goldChart'), {
                        type: 'line',
                        data: {
                            labels: history.map(h => h.date),
                            datasets: [{
                                label: 'Gold Price',
                                data: history.map(h => h.price),
                                borderColor: '#fbbf24',
                                backgroundColor: 'rgba(251, 191, 36, 0.1)',
                                fill: true,
                                tension: 0.3
                            }]
                        },
                        options: { responsive: true, maintainAspectRatio: false }
                    });
                }

                // 2. Try to get Latest Price for the cards
                const lRes = await fetch('http://localhost:3000/latest');
                const latest = await lRes.json();

                let currentPrice = latest.price;

                // Fallback: If latest is empty, use the last historical price
                if (!currentPrice && history.length > 0) {
                    currentPrice = history[history.length - 1].price;
                }

                if (currentPrice) {
                    document.getElementById('price-card').innerText = `$${currentPrice.toLocaleString()}`;

                    // Simple trend calculation vs yesterday
                    if (history.length >= 2) {
                        const prev = history[history.length - 2].price;
                        const diff = currentPrice - prev;
                        const pct = ((diff / prev) * 100).toFixed(2);
                        const trendEl = document.getElementById('trend-card');
                        trendEl.innerText = `${diff >= 0 ? '▲' : '▼'} ${pct}% from yesterday`;
                        trendEl.style.color = diff >= 0 ? '#10b981' : '#ef4444';
                    }
                    document.getElementById('status').innerText = "Live";
                }

            } catch (err) {
                document.getElementById('status').innerText = "Sync Error";
                console.error("Dashboard Error:", err);
            }
        }
        runDashboard();
    </script>
</body>
</html>
Click the index.html in the browser - you will notice that the prices of gold are being updated in real time.
Step 5: Add Fluctuation Data
- Get past gold prices by using the /rates/fluctuation endpoint.
- Keep them in an array and present on the chart to analyze the trends.
- This allows you to chart both live and historical prices and see the fluctuations with time.
Step 6: Monetization Ideas (Optional)
- Free tier: 1-5 API calls/minute, simple dashboard.
- Premium level: Up-to-date, historical charts, support multi-commodity.
- Add alerts: Warn users when gold reaches a limit.
- Provide API access: Allow other applications to use your processed data.
Helpful Resource: Best Free API For Commodity Prices (Real-Time & Historical Data)
Monetization Strategies for Gold Analytics SaaS
Revenue comes from value. Hence, you need to develop effective pricing models.
Key Models
- Subscription plans
- Premium analytics
- API access tiers
- Market alerts
- AI forecasting
You can provide high-tech capabilities by using a real time gold price API. They are portfolio tracking and predictive analytics. As a result, customers acquire insights rather than raw data. Rush also offers transaction reporting and reconciliation through its management portal or API.
Error Handling and Reliability Best Practices
The market never waits. Thus, your site has to deal with mistakes. There is a possibility of a gold API failure because of the network or rate limit. Therefore, your team must demonstrate strong expertise and handle pressure by connecting monitoring tools to your system.
Best Practices
- Always check the success response to confirm the data is valid
- Implement retry mechanisms
- Use caching layers
- Monitor usage and quota
- Maintain backup sources
For example, your system should change providers in the event of the failure of the gold price API. This will guarantee trust and dependability. You can simply switch to a backup source and continue to connect your services without interruption.
Marketing and Growth Strategy
Technology in itself is not enough to succeed. Thus, positioning and marketing are important. Pay attention to your target audience and focus on strong brand management to stay ahead of the competition.
Live data is required by jewelry businesses, traders, and fintech startups. Therefore, they use the live gold price API. You are expected to show real-time benefits and demonstrate value that customers can easily count on.
Moreover, content marketing develops credibility across communities. Publish reports, insights, and dashboards. Consequently, your website receives global clients and builds long-term trust.
Choosing the Best Gold API in 2026: Free & Paid Options
The selection of the appropriate provider is important. Gold Rate API provides real-time and historical precious metals data with strong accuracy and reliability.
You should evaluate:
- Accuracy and consistency of data.
- Frequency of updates
- Historical range
- Currency conversion support
- Support and documentation
Gold Rate API is built for easy integration, with clear documentation and SDKs for popular languages. For example, a gold price data API that supports various currencies enhances international accessibility. In addition, high support enhances the ability to integrate. Thus, companies grow more rapidly.
Helpful Resource: Top 10 Reliable Sources You Must Try
Final Thoughts: Build Your Gold SaaS With a Reliable Gold API
The current commodity data APIs are just enough to build a scalable gold analytics platform in 2026. Developers can retrieve the latest and historical precious metals prices in real time and transform the data into robust dashboards, analytics tools, and fintech apps by connecting to a Gold API.
This guide has shown how to use them in your application and how to build a scalable SaaS product with real-time commodity data.
With trusted data sources, dynamic endpoints, and historical market coverage dating back to 1990, developers can build powerful tools for traders, investors, and financial platforms.
Once you decide to start building, you can get your API key. Then you can begin adding real-time commodity price data to your application within minutes.
FAQs
What Is A Gold API?
This is a REST API that helps in getting real-time and historical data. It provide the response in JSON format. Many developers use this to integrate live prices of precious metals into applications. This is also helpful in designing dashboards, fintech platforms, and analytics platforms.
How Do Developers Use A Gold API In Applications?
The developers use HTTPS requests and an API key to connect to a Gold API. The API gives a structured JSON response of the gold prices, timestamps, and metadata. This can be displayed in dashboards, mobile apps, or financial analytics systems.
Does A Gold API Provide Historical Data?
Yes. The Gold APIs contain historical price data dating back to 1990, and usually this consists of daily open, high, low, and close prices. This information can be applied in trend analysis, forecasting models, and financial research.
Can I Build A SaaS Platform Using A Gold API?
Yes. A Gold API is used to create Gold Analytics SaaS by many fintech startups. Developers can develop tools that traders, investors, and financial analysts can use by integrating real-time prices and historical prices, along with analytics dashboards.
What Features Should You Look For In A Gold API?
Best Gold API providers will have 60-second refresh rates with real-time updates, historical access, multi-currency, high API request limits, and good documentation. The features allow developers to create scalable and reliable financial applications.