Building Commodity Price Forecasting Solutions Using Real-Time & Historical API Data
By
Ejaz Ahmed5 Feb 2026 • 13 min read
Suppose you are a procurement manager in a multinational chocolate firm. Cocoa spikes by 20% in just one week due to a supply shortage. Your production budget is ruined without a price forecast.
Your profitability shrinks, and you are scrambling to reduce risks. This situation prevails in volatile markets. You require commodity price forecasting solutions to stay ahead. This blog discusses the construction of these tools using real-time data and historical data.
We will start with data from a commodity forecasting API, including key commodity market indicators. Next, we will build machine learning price forecasting models. You will see how the full pipeline fits together.
At the end of this, you will be able to turn raw numbers into action. Actionable insights assist key stakeholders in quicker decision-making. We shall now get down into the technical framework of modern price prediction.
What Is Commodity Price Forecasting
Commodity price forecasting solutions refer to special systems that are used to predict the future price of raw materials. These digital solutions process diverse inputs that include agricultural products such as wheat and energy products such as Brent oil. These commodity price forecasting solutions help you to make informed decisions regarding large-scale purchases and financial hedging.
Predictive models strictly study past and unforeseen market trends. They consider macroeconomic factors very carefully and carry out an in-depth analysis of demand and supply. These systems are able to detect complex patterns that human analysts may overlook with the use of artificial intelligence.
This technology assists organizations in changing their reactive habits to proactive procurement strategies. The right price trends enable the procurement professionals to negotiate better with suppliers. Finally, it offers an immense competitive advantage in international business.
Why Real-Time And Historical Data Matter
Without knowing the deep past, you cannot understand the future. A time series forecasting model would never have enough data without the historical commodity price data.
This historical layer is the backbone of commodity price forecasting solutions. As it shows how prices responded to past economic indicators or world crises.
But pure history is not sufficient in a modern market. The living heart of the existing industry is the real-time commodity prices.
They are caught up in abrupt market shifts in the price of raw materials due to unexpected geopolitical events. That is why commodity price forecasting solutions also need live feeds.
A powerful process of price risk management is created when you combine both types of data. This combined method enables procurement staff to control costs far more precisely. It is the sole means to navigate successfully through the price volatility.
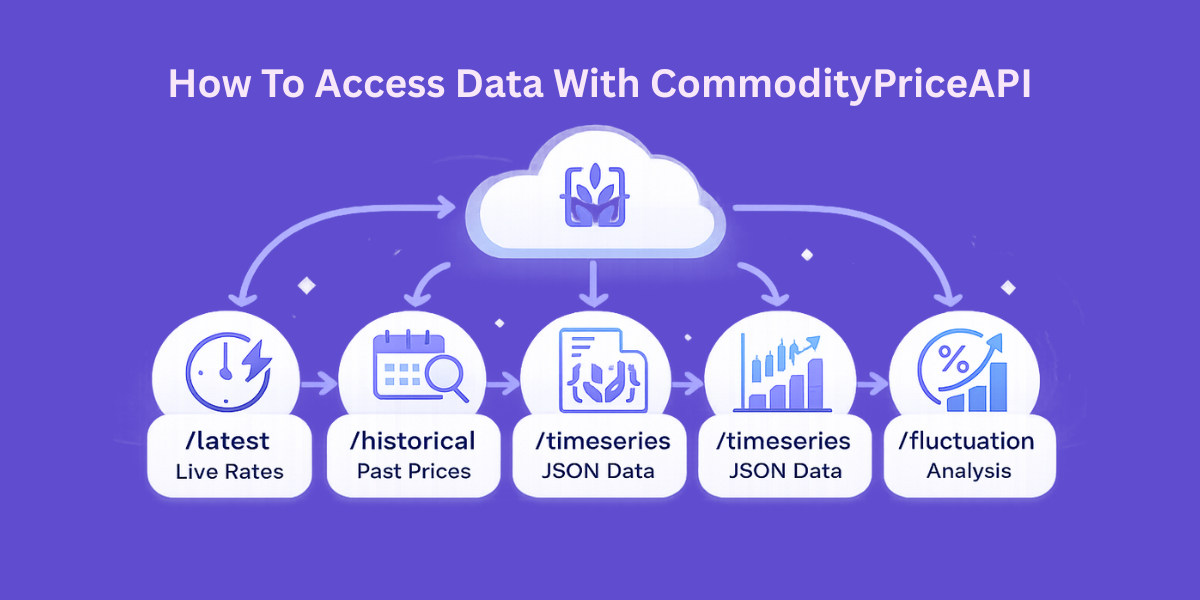
How To Access Data With CommodityPriceAPI
A reliable and consistent source of data is the first thing that you need to construct a solution. CommodityPriceAPI is a professional RESTful interface of more than 130 commodities. It is easy to retrieve the latest rates, past rates, and even individual fluctuation data.
This market intelligence is packaged in the lightweight JSON format. The API also provides real-time updates, which can be updated every 60 seconds. You also have the historical data that extends to the year 1990.
Helpful Resource: Detecting Commodity Price Fluctuations For Smarter Trading Decisions
Key API Features For Developers
The platform has a number of features that are aimed at maximizing global budgets. It allows a custom quote currency of more than 175 world currencies. This makes your demand and supply analysis relevant to your regional financial needs.
API Endpoints Overview
Endpoint | Purpose | Best Use Case |
/latest | Current commodity price | High-frequency traders |
/historical | Price on a specific date | Backtesting commodity prediction models. |
/timeseries | Data range (up to 1 year) | Training machine learning price forecasting |
/fluctuation | Change and % change | Analyzing market volatility |
Which Models Drive Price Prediction
There are a number of technical options when creating your commodity price forecasting solutions. In case of very stable and predictable trends, a simple linear regression may be used. However, the majority of businesses operate with high volatility in prices that necessitate high-level predictive analytics for commodities.
Statistical models such as ARIMA are very useful in capturing the seasonality of agricultural commodities. In other cases, deep learning algorithms such as LSTM are ideal for complicated time series prediction. These neural networks do not forget the long-term historical trends as they process new information.
Ensemble methods are becoming common in many organizations to achieve the desired objectives. This entails a combination of various models to give predictions with a lot of confidence. Such a tiered approach is more effective to manage risks compared to having a single algorithm.
Helpful Resource: How Traders Can Automate Commodity Alerts In Minutes
Practical Code Example For Data Analysis
We will consider how to retrieve data to analyze it using Python. We will leverage the /timeseries endpoint to get data to undertake a price trend analysis. This script will assist you to gather the raw material price information that you require.
import os
import requests

API_KEY = os.getenv("COMMODITYPRICEAPI_KEY", "YOUR_API_KEY")  # set env var in production
BASE_URL = "https://api.commoditypriceapi.com/v2/timeseries"

params = {
    "apiKey": API_KEY,
    "symbols": "XAU,BRENTOIL-FUT",
    "startDate": "2025-01-01",
    "endDate": "2025-12-31",
}

try:
    response = requests.get(BASE_URL, params=params, timeout=30)

    # Try to parse JSON whether it's success or error
    try:
        payload = response.json()
    except ValueError:
        payload = None

    if response.status_code == 200 and isinstance(payload, dict):
        start = payload.get("startDate", params["startDate"])
        end = payload.get("endDate", params["endDate"])
        print(f"Successfully retrieved data from {start} to {end}")

        # Optional: show what keys came back (helps you explore the structure)
        print("Top-level keys:", list(payload.keys()))

        # Optional: print 1 sample day if available (structure varies by API)
        # Uncomment once you inspect payload keys:
        # print("Sample:", next(iter(payload.get("data", {}).items())))

    else:
        # Fallback error message handling
        msg = None
        if isinstance(payload, dict):
            msg = payload.get("message") or payload.get("error") or str(payload)
        else:
            msg = response.text

        print(f"Error ({response.status_code}): {msg}")

except requests.exceptions.Timeout:
    print("Error: Request timed out. Try again or increase timeout.")
except requests.exceptions.RequestException as e:
    print(f"Error: Network/Request failed: {e}")
Here is the output
Successfully retrieved data from 2025-01-01 to 2025-12-31
Top-level keys: ['startDate', 'endDate', 'symbols', 'data']
Helpful Resource: Time-Series Analysis of Oil and Gold Prices Using a Real Time Commodity Prices API
When To Implement These Solutions
These tools should be in place way ahead of extreme market volatility sliding into your desk. These insights are applied by procurement professionals in all critical contract negotiations. When you know that a raw material will increase soon, you fix prices today using commodity price forecasting solutions.
It is always important to update your models so that you can be on top of new trends in the market. To active traders, this involves making timely decisions on market entrances and exits. In the case of a large business, commodity price forecasting solutions support safe profitability and far more reliable budgets.
The system should be operational at all times to pick up raw material price changes. Early detection can enable your team to mitigate risks when they are not costly issues. Sustainable analysis is the basis of long-term financial prosperity, and commodity price forecasting solutions make that possible.
Categories Of Commodities To Track
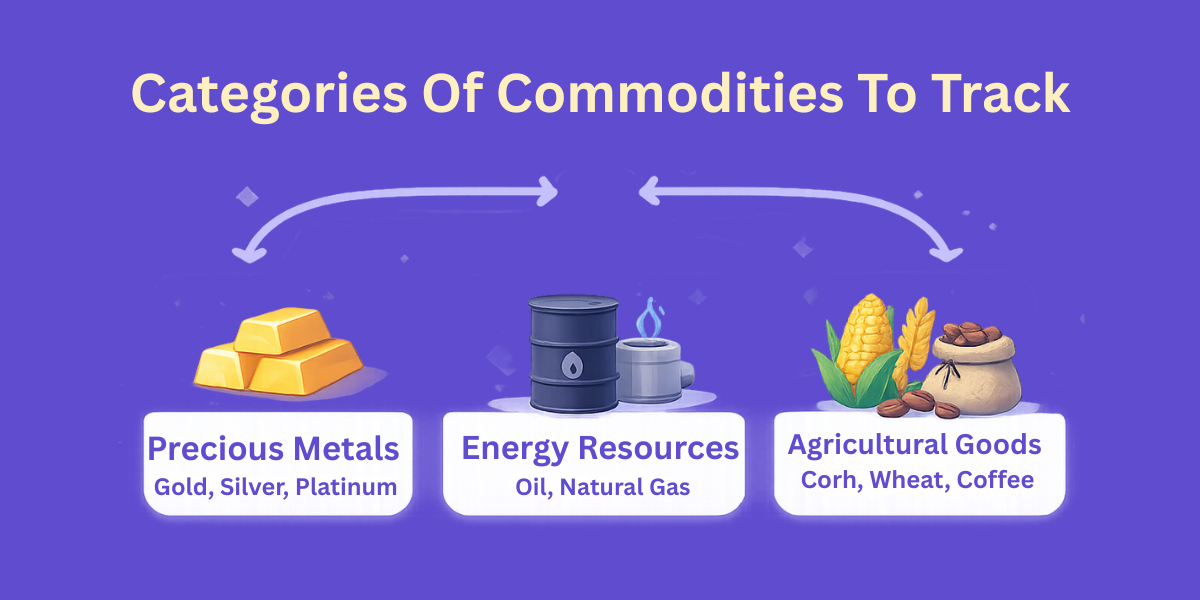
The majority of organizations concentrate their efforts on certain industrial areas. Your commodity forecasting must be strongly be industry specific for commodity price forecasting solutions. CommodityPriceAPI has the largest categories that you could need.
- Precious Metals: Invest in Gold (XAU), silver (XAG), and Platinum.
- Energy Resources: Logistics: Monitor WTI Oil, Brent Oil, and Natural Gas.
- Agricultural Goods: The agricultural goods follow Corn, Wheat, and Coffee as the food production chains.
Building a Commodity Price Forecasting Solution
Create an index.html file inside your Visual Studio Code.
Paste the following code into the HTML file.
Please replace your own API key before running the code. You can also access the complete code on our GitHub.
<!DOCTYPE html>
<html lang="en">
<head>
<meta charset="UTF-8" />
<title>Commodity Price Forecasting Solution</title>
<meta name="viewport" content="width=device-width, initial-scale=1.0"/>
<script src="https://cdn.jsdelivr.net/npm/chart.js"></script>
<style>
:root {
--primary: #0f4c75; --secondary: #3282b8; --bg: #f4f6f8;
--card: #ffffff; --text: #1f2933; --muted: #6b7280;
--success: #16a34a; --error: #dc2626; --accent: #f59e0b;
}
* { box-sizing: border-box; font-family: "Inter", system-ui, sans-serif; }
body { margin: 0; background: var(--bg); color: var(--text); line-height: 1.5; }
header { background: linear-gradient(135deg, var(--primary), var(--secondary)); color: white; padding: 40px 20px; text-align: center; }
main { max-width: 1100px; margin: -30px auto 30px; padding: 0 16px; }
.card { background: var(--card); border-radius: 12px; padding: 24px; margin-bottom: 24px; box-shadow: 0 10px 25px rgba(0,0,0,0.1); }
.grid { display: grid; grid-template-columns: 1fr 1fr; gap: 20px; }
@media (max-width: 768px) { .grid { grid-template-columns: 1fr; } }
label { display: block; font-weight: 600; margin-bottom: 6px; font-size: 14px; }
select, input, button { width: 100%; padding: 12px; margin-bottom: 14px; border-radius: 8px; border: 1px solid #d1d5db; font-size: 15px; }
button { background: var(--primary); color: white; border: none; cursor: pointer; font-weight: 600; transition: 0.2s; }
button:hover { background: var(--secondary); transform: translateY(-1px); }
.csv-btn { background: var(--success); }
.status { padding: 12px; border-radius: 6px; margin-top: 10px; font-size: 14px; display: none; }
.error { display: block; background: #fee2e2; color: var(--error); border: 1px solid #fecaca; }
.success { display: block; background: #dcfce7; color: var(--success); border: 1px solid #bbf7d0; }
.forecast-badge { background: var(--accent); color: white; padding: 4px 8px; border-radius: 4px; font-size: 12px; float: right; }
.chart-container { position: relative; height: 45vh; width: 100%; margin-top: 20px; }
table { width: 100%; border-collapse: collapse; margin-top: 20px; }
th, td { padding: 12px; border-bottom: 1px solid #e5e7eb; text-align: left; }
th { background: #f8fafc; }
</style>
</head>
<body>
<header>
<h1>📊 Commodity Forecasting Solution</h1>
<p>Harnessing API Data for Predictive Procurement</p>
</header>
<main>
<div class="grid">
<div class="card">
<h2>🔴 Real-Time Spot</h2>
<label>Commodity Symbol</label>
<select id="liveSymbol">
<option value="XAU">Gold (XAU)</option>
<option value="XAG">Silver (XAG)</option>
<option value="WTIOIL-FUT">WTI Crude Oil</option>
<option value="BRENTOIL-FUT">Brent Oil</option>
<option value="NG-FUT">Natural Gas</option>
</select>
<button onclick="getLivePrice()">Get Current Price</button>
<div id="liveResult" class="status"></div>
</div>
<div class="card">
<h2>📅 Historical & Predictive Analysis</h2>
<label>Training Data Range</label>
<div style="display: flex; gap: 10px;">
<input type="date" id="startDate">
<input type="date" id="endDate">
</div>
<button onclick="handleHistoricalRequest()">Fetch & Forecast</button>
<button id="downloadBtn" class="csv-btn" style="display:none;" onclick="downloadCSV()">Export Data to CSV</button>
</div>
</div>
<div class="card" id="analyticsSection" style="display:none;">
<span class="forecast-badge" id="forecastTrend">Analysis Pending</span>
<h2>📈 Market Insights & Forecast</h2>
<div id="historyStatus" class="status"></div>
<div class="chart-container">
<canvas id="priceChart"></canvas>
</div>
<div id="historyTable"></div>
</div>
</main>
<script>
const API_KEY = "add-your-api-key-here";
const BASE_URL = "https://api.commoditypriceapi.com/v2";
let chartInstance = null;
let globalDataStore = [];
async function getLivePrice() {
const symbol = document.getElementById("liveSymbol").value;
const result = document.getElementById("liveResult");
result.style.display = "block";
result.className = "status";
result.textContent = "Fetching live feed...";
try {
const res = await fetch(`${BASE_URL}/rates/latest?symbols=${symbol}`, {
headers: { "x-api-key": API_KEY }
});
const data = await res.json();
if (!data.success) throw new Error(data.message);
const val = data.rates[symbol];
result.innerHTML = `<strong>Current ${symbol} Spot:</strong> $${val.toLocaleString()} USD`;
result.className = "status success";
} catch (err) {
result.textContent = err.message;
result.className = "status error";
}
}
async function handleHistoricalRequest() {
const symbol = document.getElementById("liveSymbol").value;
const startInput = document.getElementById("startDate").value;
const endInput = document.getElementById("endDate").value;
const status = document.getElementById("historyStatus");
const analytics = document.getElementById("analyticsSection");
if (!startInput || !endInput) return alert("Please select date range.");
analytics.style.display = "block";
status.style.display = "block";
status.className = "status";
status.textContent = "Gathering historical data batches...";
globalDataStore = [];
let currentStart = new Date(startInput);
const finalEnd = new Date(endInput);
try {
while (currentStart < finalEnd) {
let batchEnd = new Date(currentStart);
batchEnd.setFullYear(batchEnd.getFullYear() + 1);
if (batchEnd > finalEnd) batchEnd = finalEnd;
const sStr = currentStart.toISOString().split('T')[0];
const eStr = batchEnd.toISOString().split('T')[0];
const res = await fetch(`${BASE_URL}/rates/time-series?symbols=${symbol}&startDate=${sStr}&endDate=${eStr}`, {
headers: { "x-api-key": API_KEY }
});
const data = await res.json();
if (!data.success) throw new Error(data.message);
for (const date in data.rates) {
const entry = data.rates[date][symbol];
const price = typeof entry === 'object' ? entry.close : entry;
globalDataStore.push({ date, price });
}
currentStart = new Date(batchEnd);
currentStart.setDate(currentStart.getDate() + 1);
}
const forecastData = runLinearForecasting();
renderAnalytics(symbol, forecastData);
status.textContent = "Data successfully processed and forecasting model updated.";
status.className = "status success";
document.getElementById("downloadBtn").style.display = "block";
} catch (err) {
status.textContent = "System Error: " + err.message;
status.className = "status error";
}
}
function runLinearForecasting() {
globalDataStore.sort((a, b) => new Date(a.date) - new Date(b.date));
const n = globalDataStore.length;
if (n < 2) return null;
let sumX = 0, sumY = 0, sumXY = 0, sumXX = 0;
globalDataStore.forEach((d, i) => {
sumX += i;
sumY += d.price;
sumXY += i * d.price;
sumXX += i * i;
});
const slope = (n * sumXY - sumX * sumY) / (n * sumXX - sumX * sumX);
const intercept = (sumY - slope * sumX) / n;
const nextPrice = slope * n + intercept;
const trend = slope > 0 ? "BULLISH" : "BEARISH";
document.getElementById("forecastTrend").textContent = `Forecast: ${trend} | Next Est: $${nextPrice.toFixed(2)}`;
return { slope, intercept, nextPrice };
}
function renderAnalytics(symbol, forecast) {
const labels = globalDataStore.map(d => d.date);
const values = globalDataStore.map(d => d.price);
// Add one future date to labels for the forecast
const lastDate = new Date(labels[labels.length-1]);
lastDate.setDate(lastDate.getDate() + 1);
const forecastLabel = lastDate.toISOString().split('T')[0];
if (chartInstance) chartInstance.destroy();
const ctx = document.getElementById('priceChart').getContext('2d');
chartInstance = new Chart(ctx, {
type: 'line',
data: {
labels: [...labels, forecastLabel],
datasets: [{
label: `Historical ${symbol} Price`,
data: values,
borderColor: '#3282b8',
backgroundColor: 'rgba(50, 130, 184, 0.1)',
fill: true,
tension: 0.2
},
{
label: 'Regression Forecast',
data: [...Array(n = globalDataStore.length).fill(null), forecast.nextPrice],
borderColor: '#f59e0b',
pointStyle: 'triangle',
pointRadius: 8,
showLine: false
}]
},
options: {
responsive: true,
maintainAspectRatio: false,
plugins: { tooltip: { mode: 'index' } }
}
});
let table = `<table><tr><th>Date</th><th>Price (USD)</th><th>Type</th></tr>`;
globalDataStore.slice(-5).reverse().forEach(row => {
table += `<tr><td>${row.date}</td><td>$${row.price.toFixed(2)}</td><td>Actual</td></tr>`;
});
table += `<tr style="color:var(--accent); font-weight:bold;"><td>${forecastLabel}</td><td>$${forecast.nextPrice.toFixed(2)}</td><td>Forecasted</td></tr>`;
table += `</table>`;
document.getElementById("historyTable").innerHTML = table;
}
function downloadCSV() {
const symbol = document.getElementById("liveSymbol").value;
let csv = "Date,Symbol,Price_USD,Type\n";
globalDataStore.forEach(row => {
csv += `${row.date},${symbol},${row.price},Actual\n`;
});
const blob = new Blob([csv], { type: 'text/csv' });
const url = window.URL.createObjectURL(blob);
const a = document.createElement('a');
a.href = url; a.download = `Forecast_Data_${symbol}.csv`;
a.click();
}
</script>
</body>
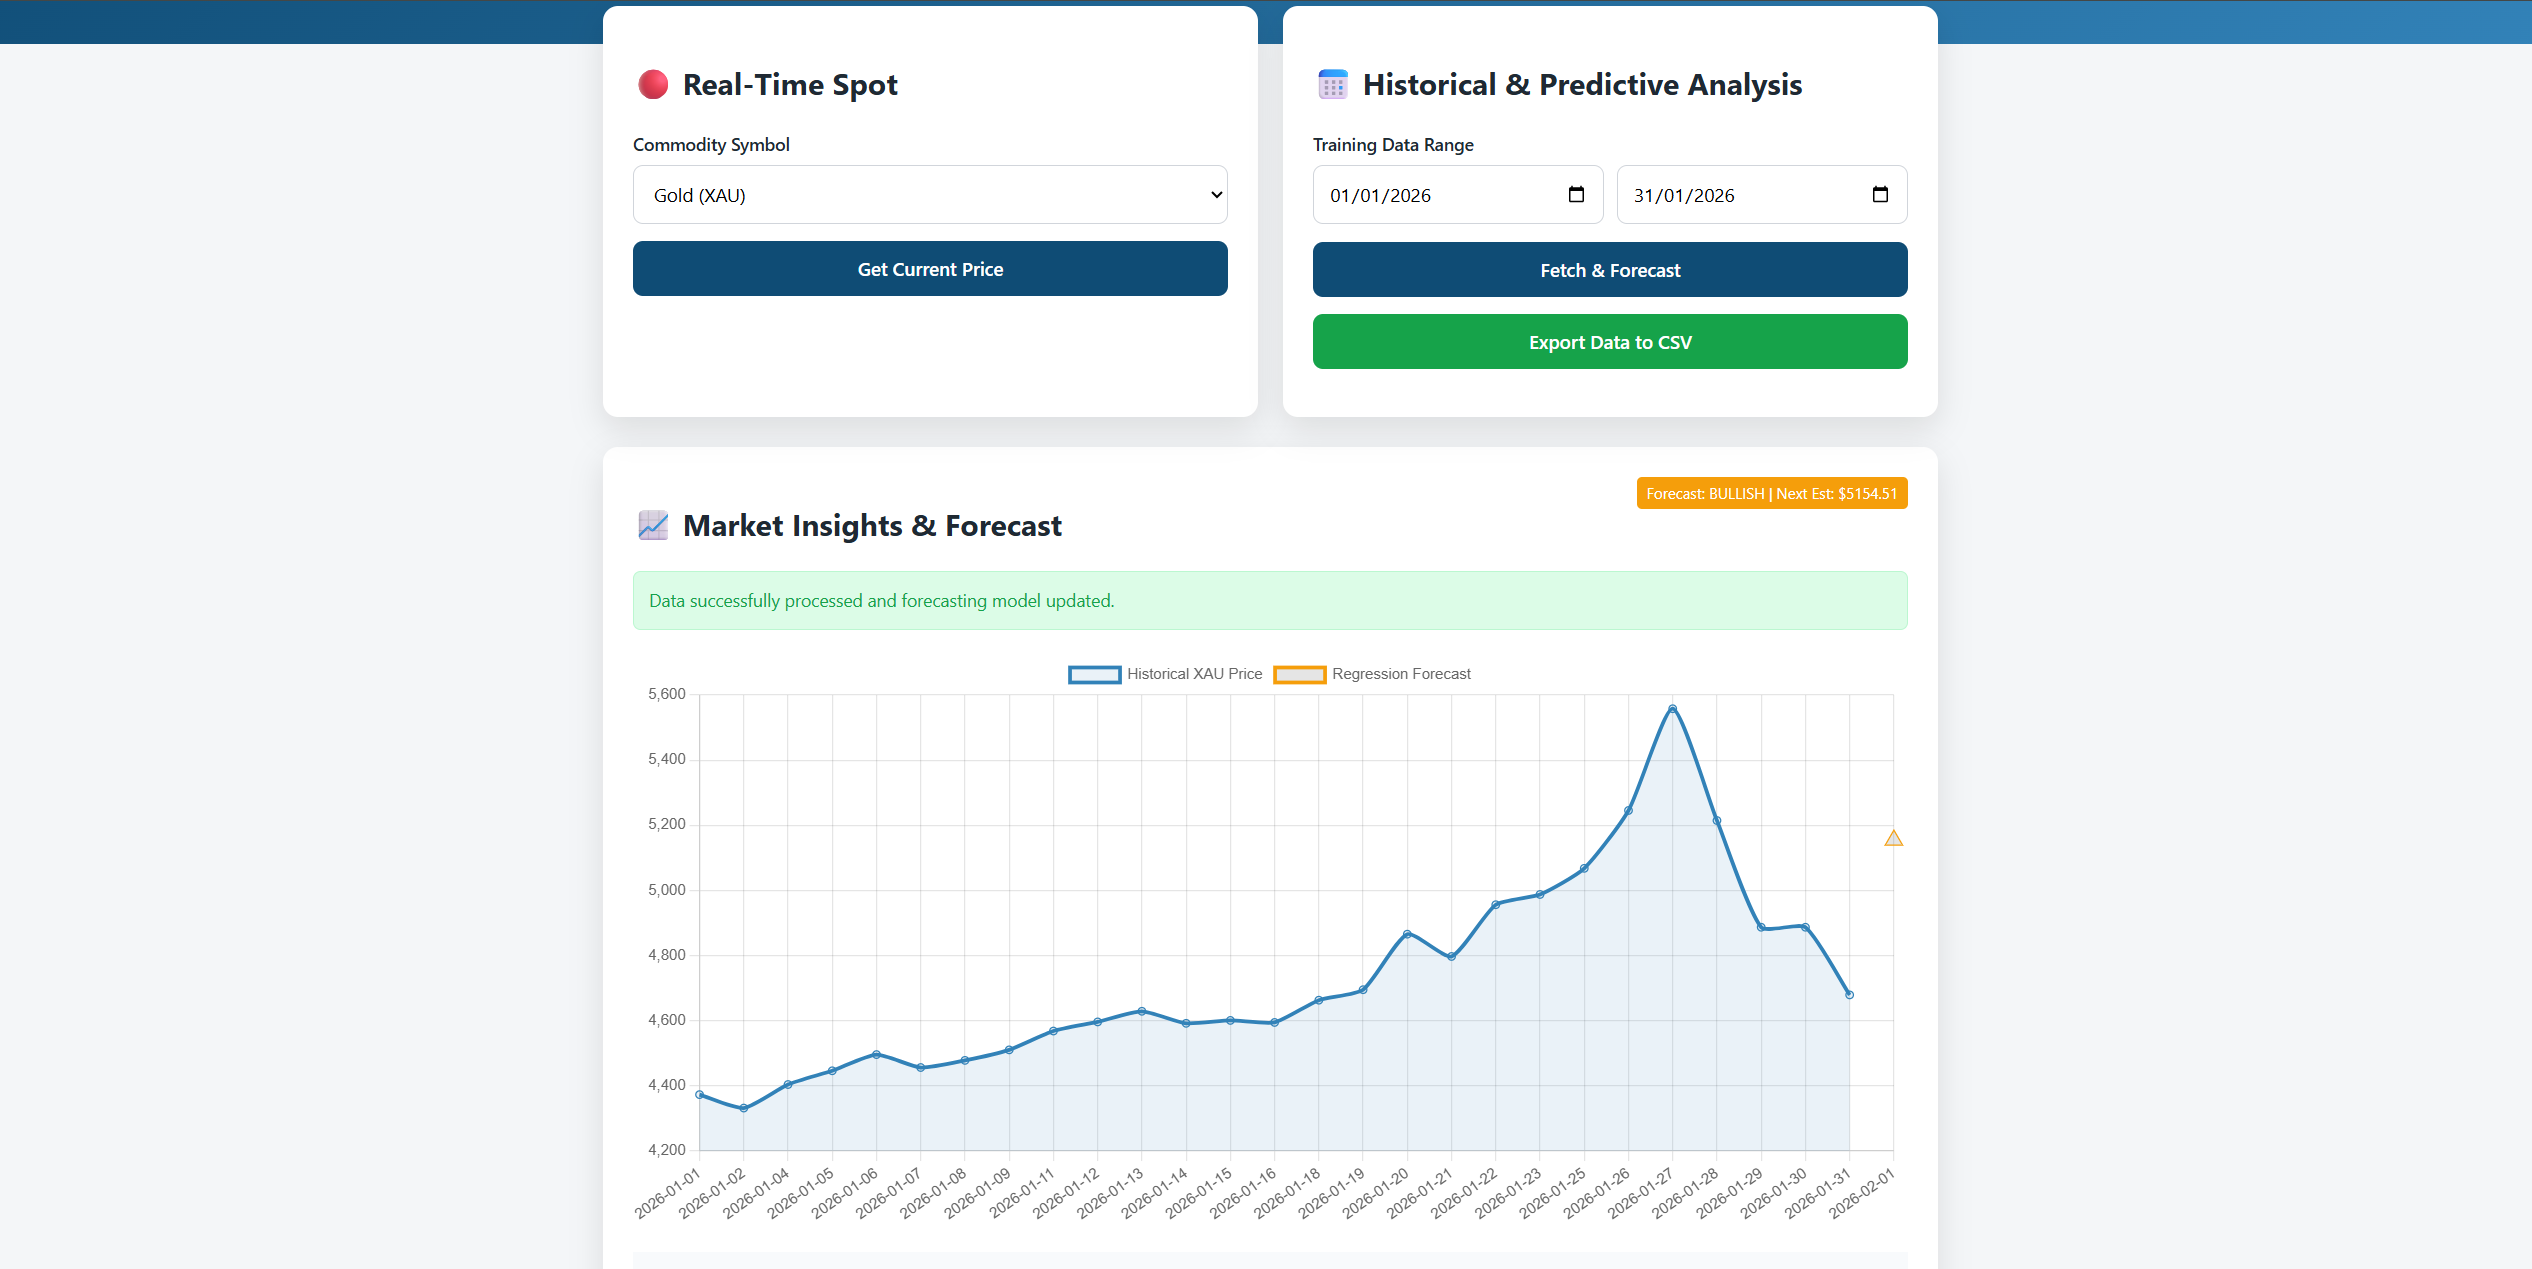
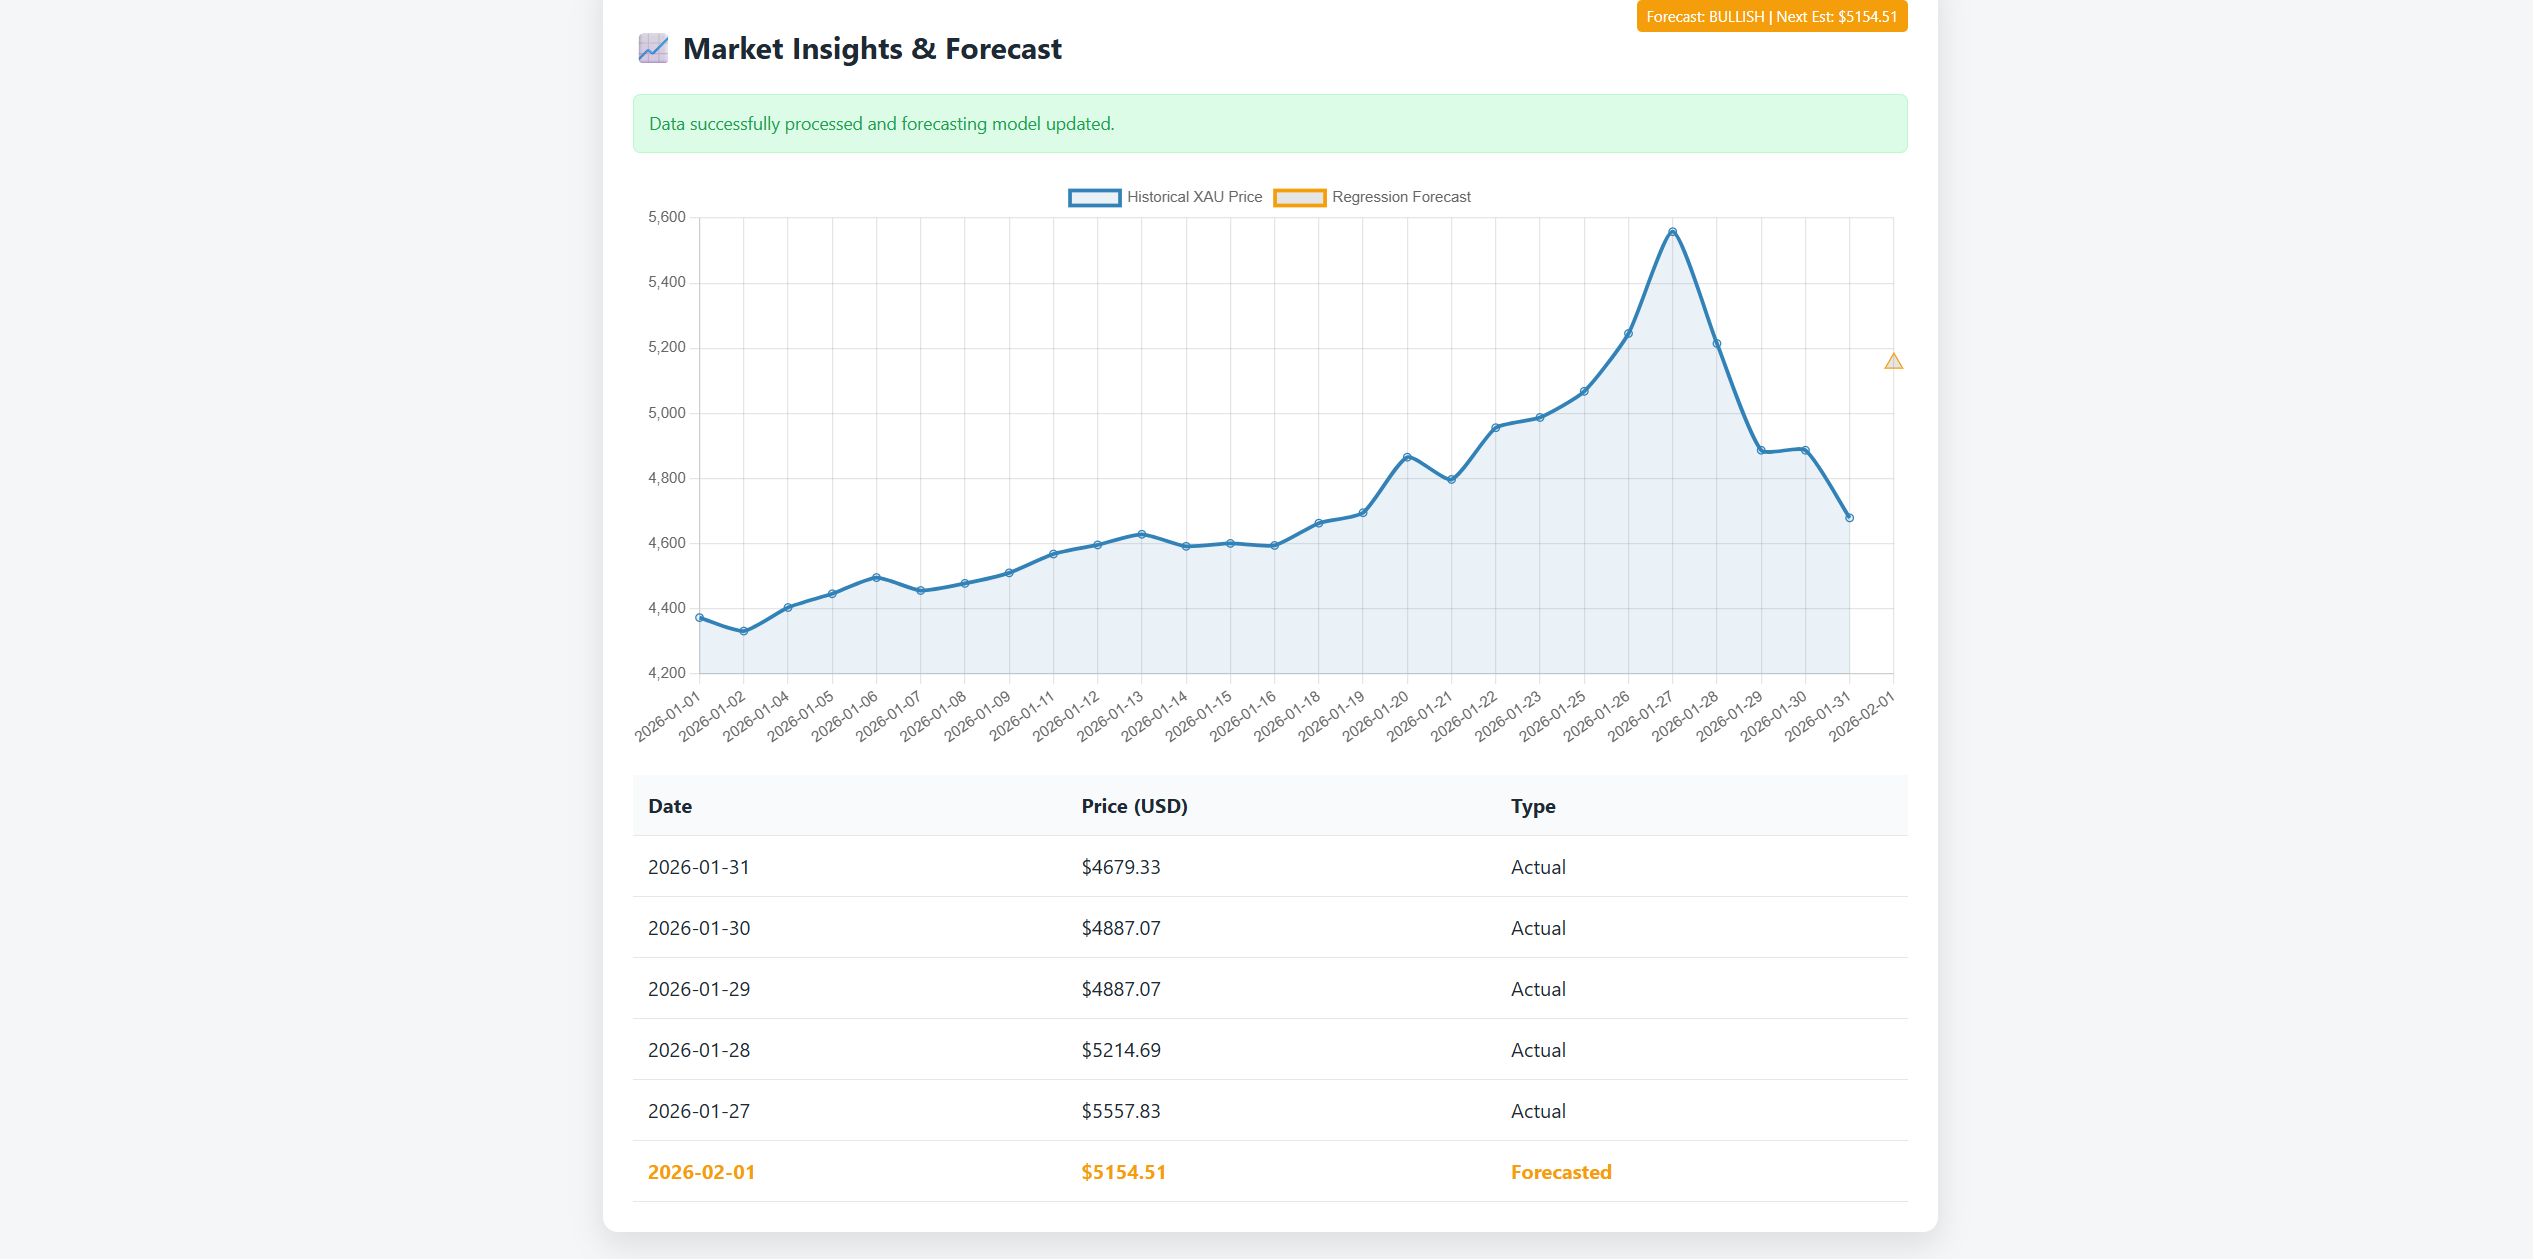
</html>We successfully integrated real-time spot rates for immediate risk monitoring while leveraging a looping historical logic to feed a linear regression forecasting model. By automating data parsing and visualization, the solution transforms raw numbers into actionable market insights. As a result, it also allows procurement managers to anticipate price spikes rather than simply react to them.
When you run the code, here is what you get:
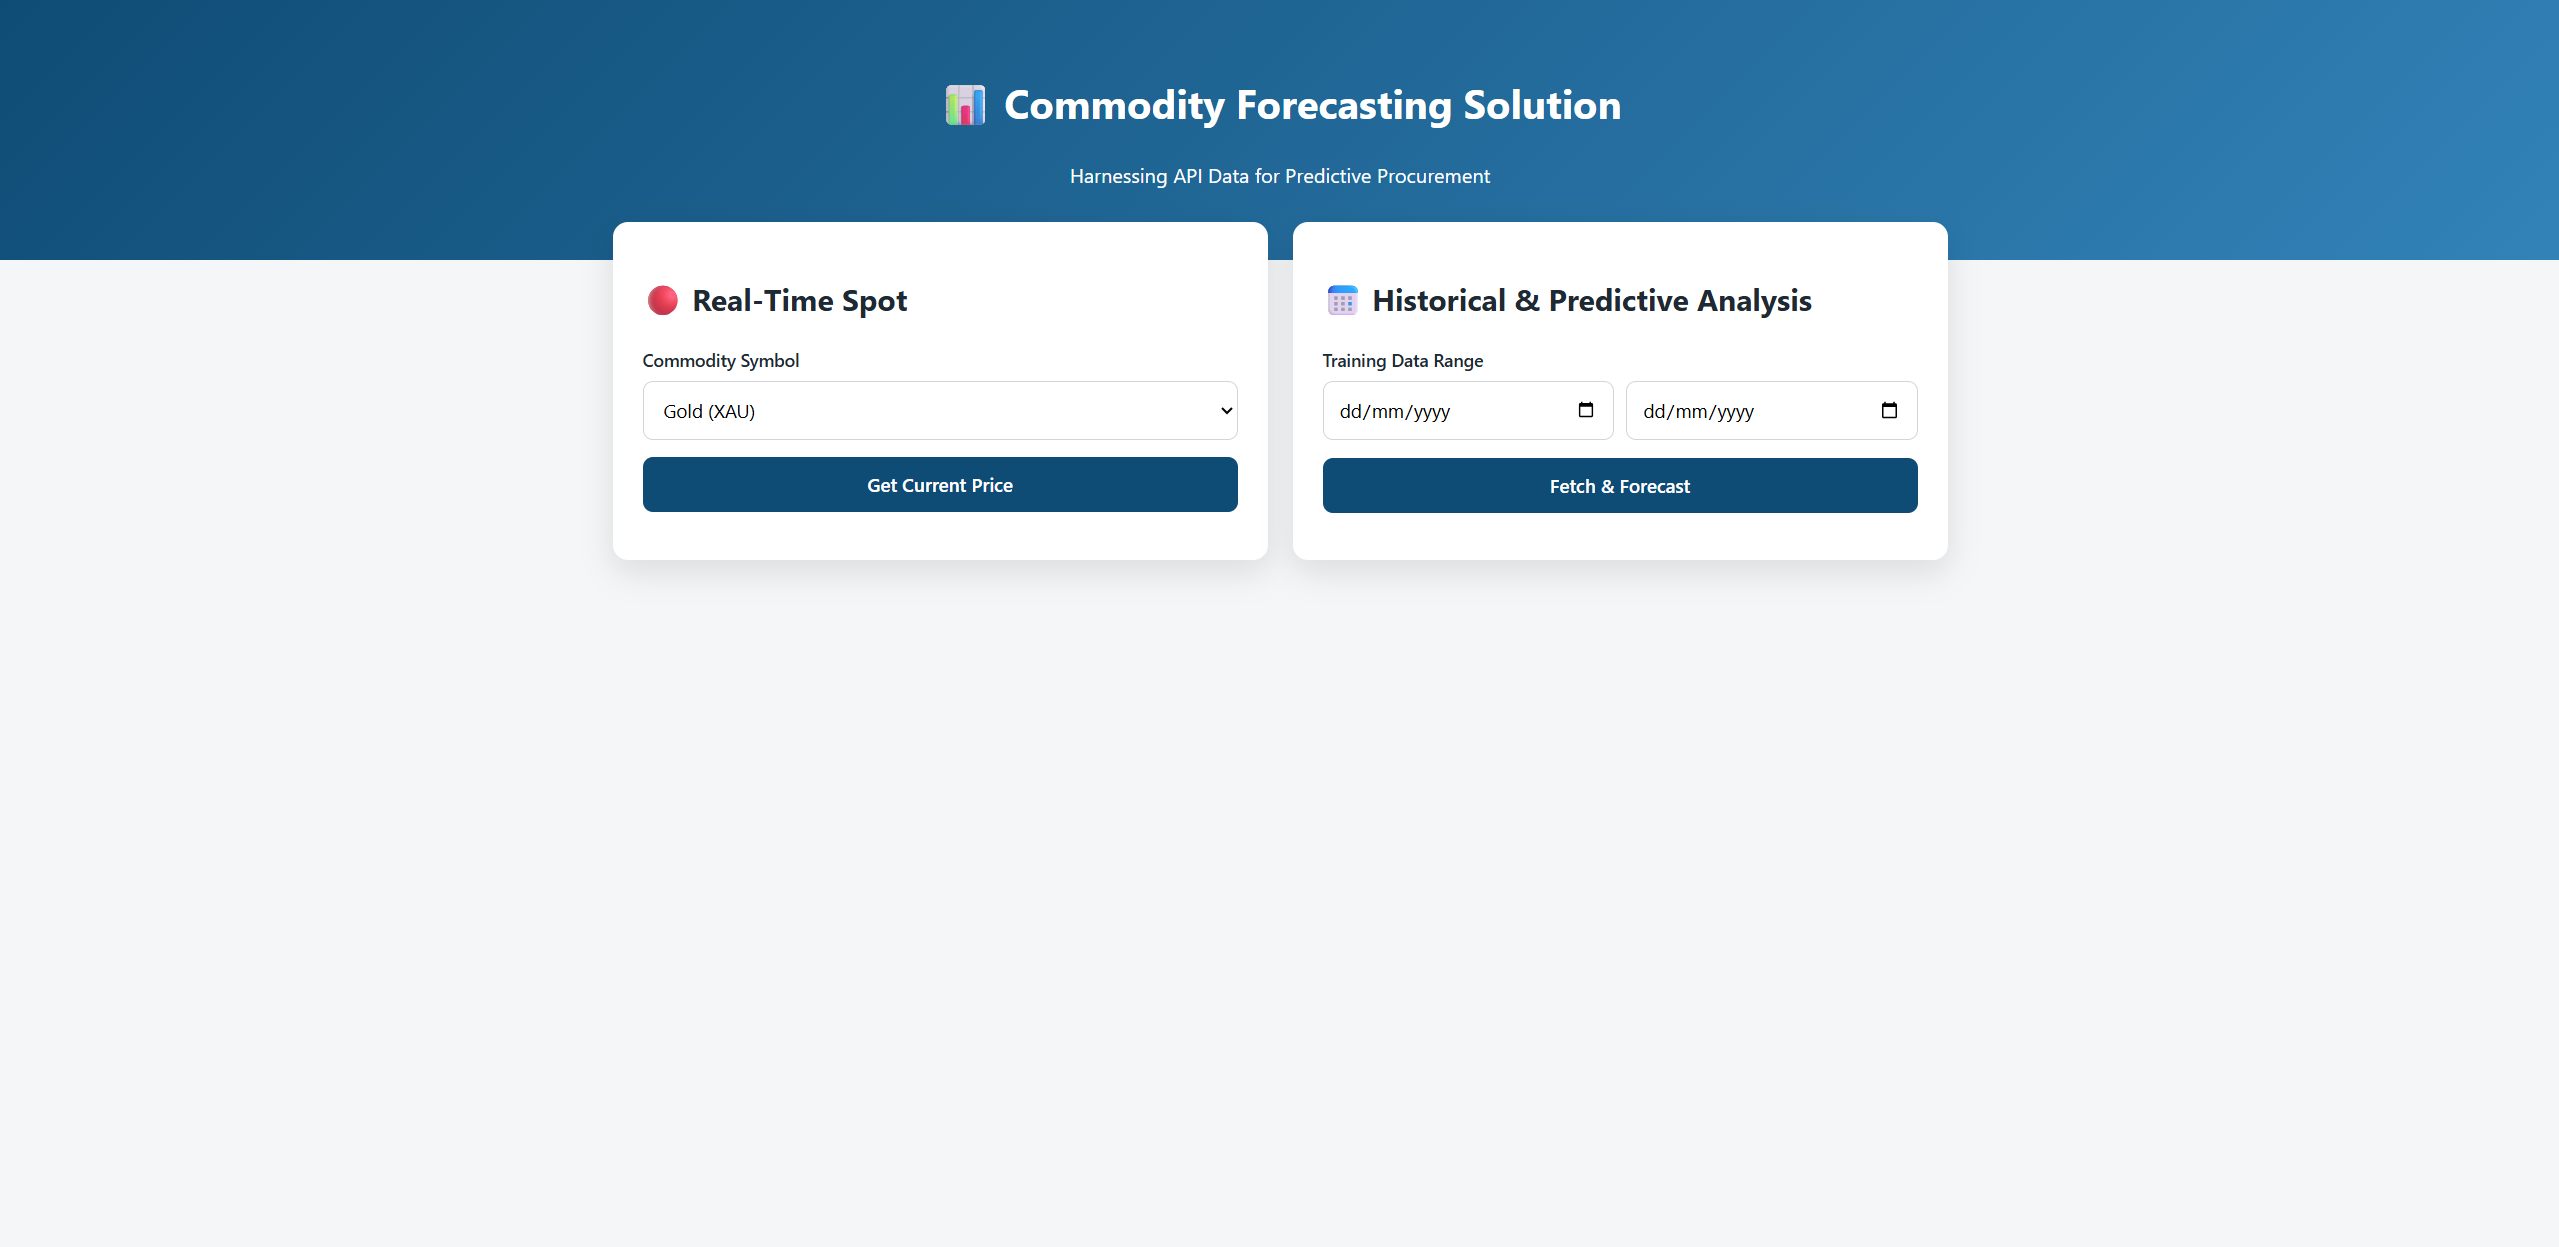
We chose Gold as our target symbol and set the date of January to track prices:
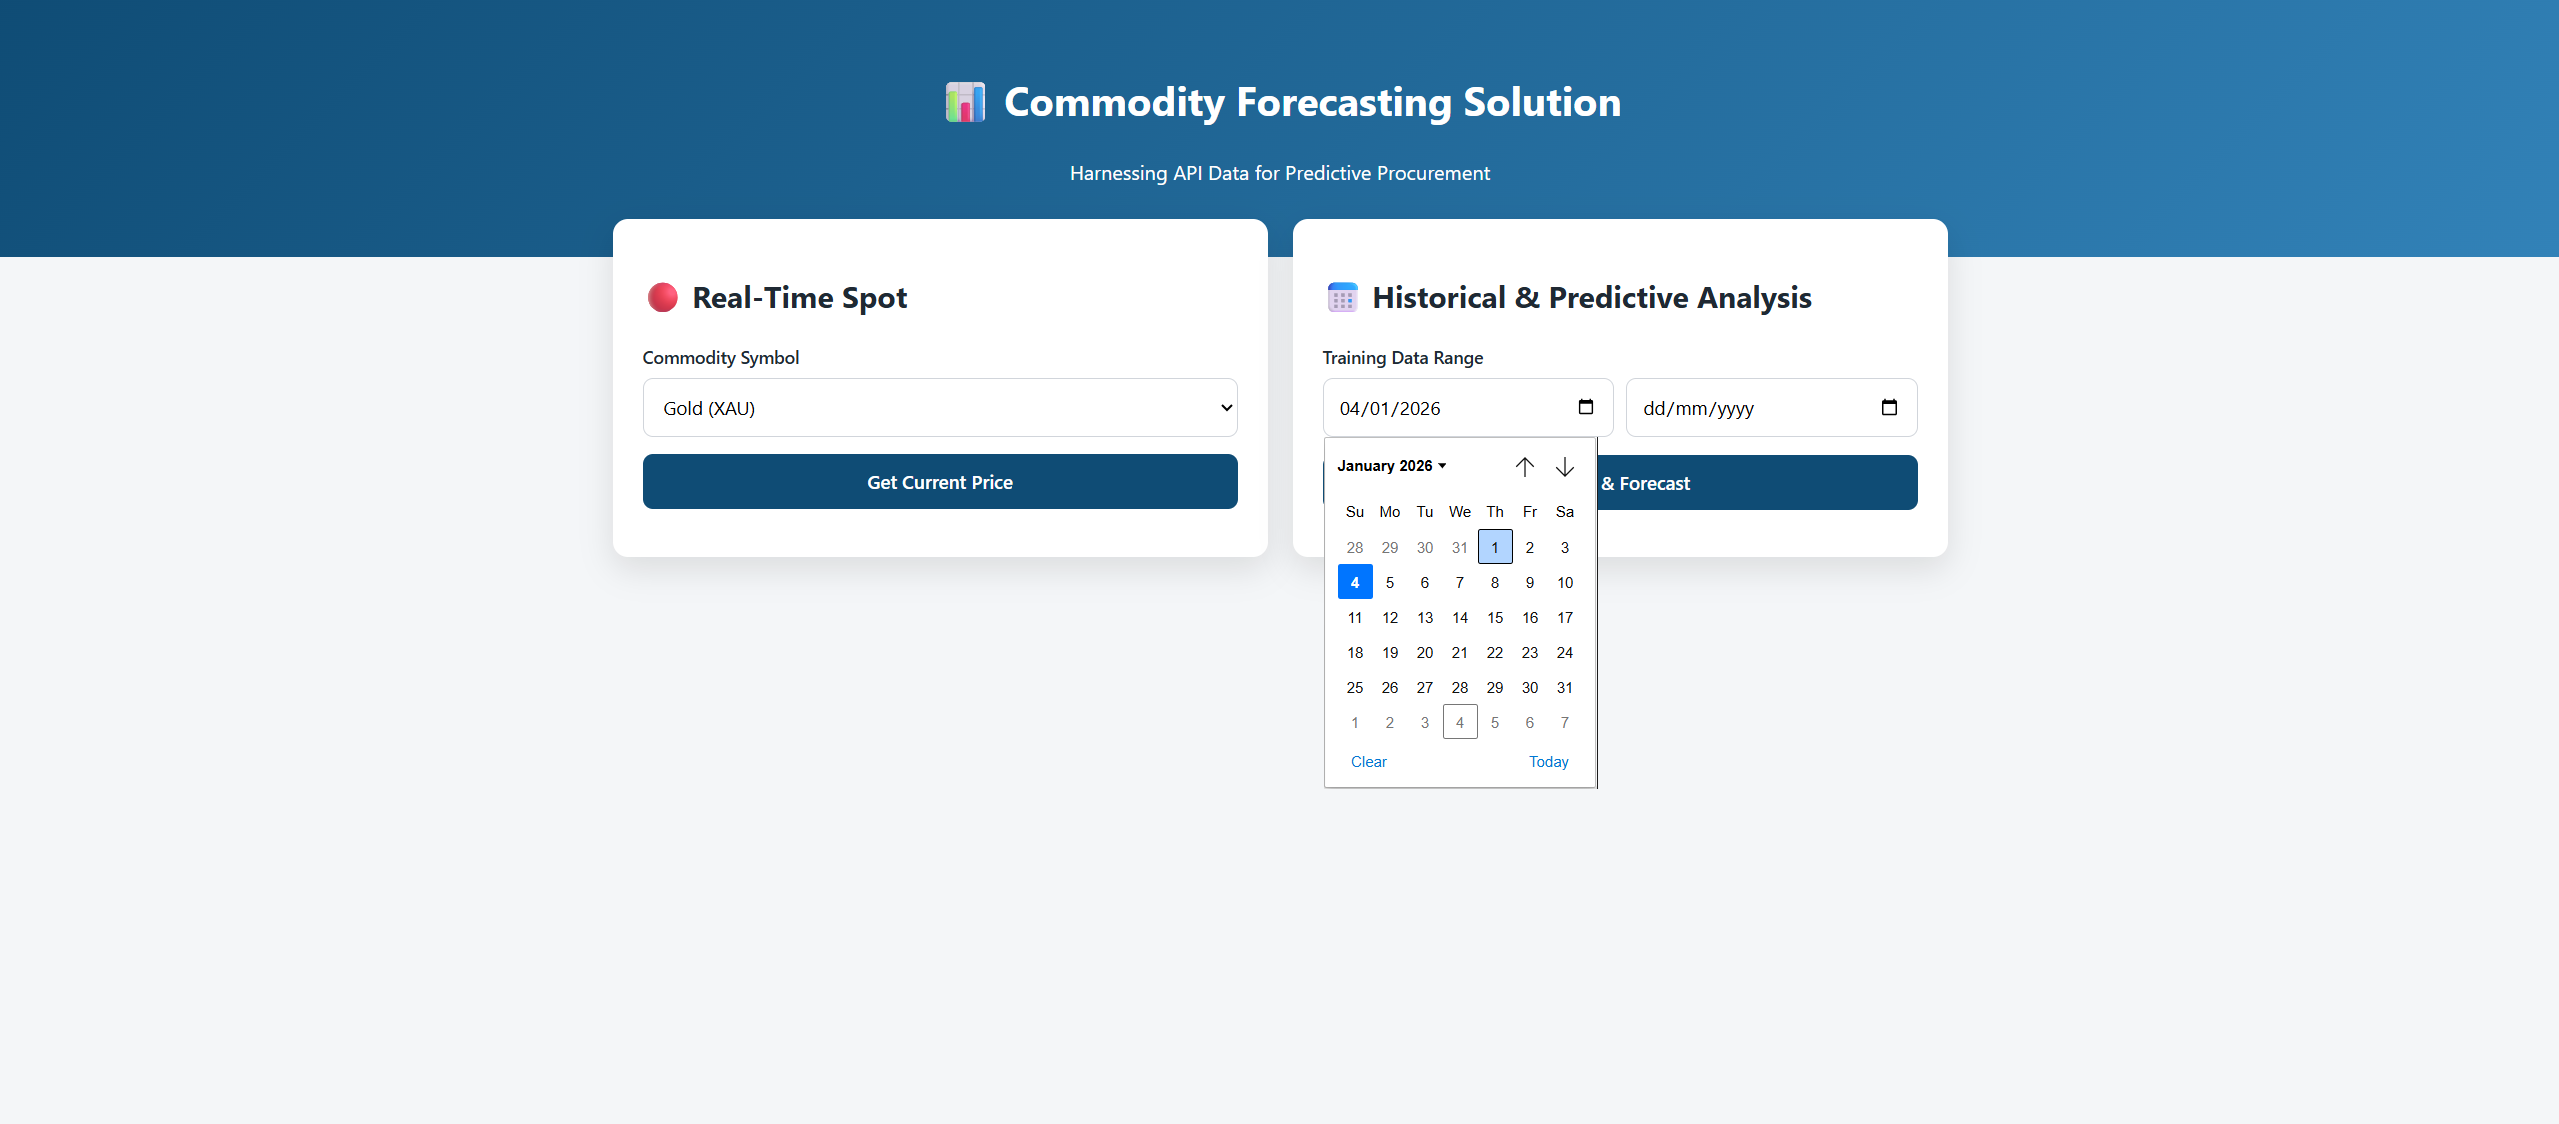
Once we click Fetch and Forecast, we will see a complete dashboard like the one shown below. You can also export the data to a CSV format:
TL;DR
Commodity price forecasting solutions are based on using real time information and past information to forecast the price trend. CommodityPriceAPI is a trusted forecasting API for commodity information on 130 commodities. Artificial intelligence assists in risk management and risk mitigation in highly volatile markets.
Conclusion
It is no longer optional to build a custom solution to predict commodity prices. Through this real-time update and historical data, you are able to gather the market intelligence that helps you to survive.
These systems enable you to make wise choices that protect the profitability of your company. This is the foundation of strong commodity price forecasting solutions.
The appropriate data will provide a competitive edge to both the developer and the procurement specialist. Begin with small steps, with professional analysis. Create a system that gives your main stakeholders confidence.
The savings you are going to make tomorrow are dependent on what you do today. This is why teams invest in reliable commodity price forecasting solutions.
FAQs
How Accurate Are Commodity Price Prediction Models?
The quality of data and other macroeconomic factors are critical in determining accuracy. No model is flawless, but a strong methodology can help you lower your price risk by a great margin. The model can be calibrated regularly to enhance reliability in the long run.
Can I Use This API For Long Term Projections?
Yes, you definitely can. You can train commodity price forecasting solutions to make long term projections by accessing historical trends as far back as 1990. This assists you in realizing cycling market changes that occur over decades.
Is Real-Time Data Necessary For All Commodities?
Real-time data is a must in highly volatile markets such as energy. In the case of certain agricultural products, you may not need the products to be updated on a daily or regular basis. Never exceed the frequency of data with the volatility of the asset.
How Do I Choose The Right Commodity Market Indicators?
Choose indicators that actually move your commodity’s price. For cocoa, that usually means weather, supply reports, and currency changes. Start with a few, then only add more if your forecast gets better.
How Often Should I Retrain My Machine Learning Price Forecasting Models?
Retrain more often for volatile markets like oil. Monthly is a safe starting point for many teams using commodity price forecasting solutions. If accuracy drops, retrain sooner.
How Do I Validate Forecasts Before Using Them In Procurement?
Test the model on past periods it has not seen. Compare it with a simple baseline like last week’s price. If it beats the baseline consistently, it is usable.