Time-Series Analysis of Oil and Gold Prices Using a Real Time Commodity Prices API
By
Ejaz Ahmed4 Jan 2026 • 11 min read
Oil and gold are at the heart of global trade. Every economy feels its movement in some way. They influence transport costs and the way people think about saving.
Oil prices ripple through inflation, logistics, and production costs. Gold prices show how people feel about risk and safety. They also shape currency moves, trade balances, and investor decisions.
Looking only at commodity prices today hides important context. Markets fall, recover, and repeat. Time-series analysis helps track those movements with accurate data from a real time commodity prices api.
This guide shows how oil and gold prices behave across time. It explains what matters and what can be ignored. You will leave with a clearer view of market movement.
Understanding Time-Series Analysis in Commodity Markets
Time-series data tracks values over consistent time intervals. Prices build on past values through historical data and clear market data. This helps explain markets that rarely sit still.
The commodities market responds fast when the economy changes and tensions build. Commodities pricing data for assets like natural gas shows clear shifts tied to currency pressure and exchange activity. Supply shortages, policy changes, and conflicts leave visible marks over time.
Trends show direction, seasonality reveals repetition, and cycles expose deeper behavior. Random spikes still exist and must be handled carefully during analysis. Reliable services matter because small errors compound across long timelines.
Why Focus on Oil and Gold Together?
Oil reflects growth, demand, and industrial activity. When economies expand, oil demand usually follows across global markets. When growth slows, oil often reacts first.
Gold behaves differently under stress and uncertainty. Investors move toward it during inflation scares or currency weakness. It also stands out among precious metals during unstable periods.
Looking at both together gives a deeper context than historical prices alone. It makes clear how markets react differently during growth and stress. Studying both sides gives clearer insight.
Comparing both highlights balance between risk and safety. Traders use real time market data to hedge exposure more effectively. Businesses apply the same logic when planning costs tied to agricultural commodities.
Data Sources for Commodity Time-Series Analysis
Reliable data is the backbone of any serious analysis. Inconsistent inputs lead to misleading results. Tracking commodities prices becomes risky without a dependable commodities api.
Many financial institutions rely on steady feeds to avoid confusion. Small errors grow when markets move fast. Clean sources help keep analysis grounded.
Common Data Issues in Commodity Price Feeds
Timestamps may not align, and gaps often appear in scraped datasets. These missing data points weaken long-term studies. The problem grows when prices update across regions.
Currency mismatches further distort results. This affects tracking across industrial metals and agricultural products. Confidence drops when numbers fail to line up.
How APIs Improve Commodity Data Reliability
APIs solve many of these issues cleanly. They support assets like crude oil and heating oil without manual cleanup. Structured access saves time and avoids mistakes.
Markets like live cattle futures also benefit from stable feeds. CommodityPriceAPI provides structured access with consistent formatting. Using a trusted real time commodity prices api improves automation and accuracy.
Overview of CommodityPriceAPI for Commodity Price Data
CommodityPriceAPI brings live and historical market data into one clear view. It supports oil, gold, and currency information together. This helps keep cross-market analysis clear with real time and historical coverage from 1990.
Market Coverage and Data Scope
CommodityPriceAPI covers key commodity sectors with clear, focused data. You can track energy symbols like WTIOIL-FUT, BRENTOIL-FUT, and NG-FUT, along with metals such as XAU and XAG. This keeps coverage aligned with real trading use cases.
The API uses a simple REST structure with clean JSON responses. You can use it from any language right away. There is no need for any cleanup.
Prices update live and mirror real market moves. Futures change as supply and demand shift throughout the day. Even when markets get choppy, the data keeps flowing smoothly.
Reliability and System Integration
Coverage spans global commodity markets across long time ranges. Pricing stays consistent for both historical and real time data. Exchange rates only apply when converting commodity prices between currencies.
The system supports research, dashboards, and monitoring tools. Analysts track energy trends without juggling sources. The same setup works for broader energy analysis.
Data consistency helps teams trust what they see. It reduces confusion during fast market shifts. That reliability matters when reacting to news.
The platform fits well into any analytics system. It scales as needs grow without added friction. Everything stays organized and easy to manage.
Collecting Historical Oil and Gold Price Data
Start by deciding your time window. Use the /historical endpoint for specific past dates and /timeseries when you need continuous data, with a one-year limit in mind. Daily data catches the noise while monthly data shows the trend.
Choosing a base currency avoids comparison issues. Many analysts normalize values to USD. This makes it easier to compare prices across global commodity markets.
Missing days and holidays need careful handling. Sudden spikes should be flagged, not removed blindly. Proper timestamp alignment keeps oil and gold comparisons accurate.
Structuring Commodity Time-Series Data
A clean dataset follows a predictable structure for tracking commodities. Each row includes a timestamp, asset type like XAU (Gold), WTIOIL-FUT (WTI Crude), feeder cattle or live cattle, and a clear price. Data often comes in structured JSON to keep things easy to read.
Consistent intervals reduce analytical errors over time. Storage options range from CSV files to time-series databases based on scale and access. Some setups include additional fees for storage or processing.
Prepared data supports visualization and forecasting without friction. A clean structure gives better access to real time insights when markets move fast. It also makes access across tools easier when teams share results.
Analyzing Historical Trends in Oil Prices
Oil prices react quickly to supply decisions. OPEC moves, and global tensions often cause clear changes. Price drops usually show up before economic slowdowns.
Long-term charts show patterns that repeat over time. Big swings often happen during crisis periods. Moving averages calm the noise and make trends easier to read.
Oil price history often reflects how the economy is really doing. Sharp drops can hint at recession risk before other signs appear. Consistent growth usually shows that demand is increasing.
Analyzing Historical Trends in Gold Prices
Gold often rises during uncertainty. Inflation periods and financial crises highlight this behavior clearly. Its stability attracts long-term holders.
Compared to oil, gold shows smoother movement. Volatility exists but remains lower over long spans. This makes it useful as a hedge.
With time, you begin to notice support and resistance levels in commodity trading prices. Similar market conditions often lead to repeating patterns. Gold prices often reveal how investors feel about risk.
Correlation Analysis Between Oil and Gold
Correlation shows how two assets move together in stock market commodities. Oil and gold sometimes move the same way, but not always. The reason usually comes down to what is happening around them.
Interest rates and currency strength play major roles. A strong dollar can pressure both assets differently. Global risk sentiment changes correlations over time.
Correlation is never fixed. It evolves with macro conditions. Understanding this helps diversify portfolios.
Real-Time Monitoring vs Historical Insights
Live tracking focuses on current commodity prices. Historical analysis explains why those prices behave as they do. Both views serve different goals.
Past trends inform alerts and thresholds. Stored data gives meaning to sudden moves. Live feeds alone lack context.
Combining both improves decisions. A real time commodity prices api supports this balance. It enables monitoring without losing historical depth.
Building Time-Series Analysis Dashboard with Commodities API
Prerequisites
Make sure you have installed:
- Node.js (includes npm) → https://nodejs.org
- A code editor (VS Code recommended)
- CommodityPriceAPI account → Get your API key
Project Structure
We’ll create this folder structure:
commodity-dashboard/
├── backend/
│   └── index.js
├── frontend/
│   ├── package.json
│   └── src/
│       ├── App.js
│       └── components/
│           ├── Dashboard.js
│           ├── CommoditySelector.js
│           └── TimeSeriesChart.js
Setup Backend
Open terminal → navigate to your main project folder:
mkdir commodity-dashboard
cd commodity-dashboard
mkdir backend
cd backend
npm init -y
npm install express axios cors
Create index.js inside backend/:
const express = require('express');
const axios = require('axios');
const cors = require('cors');

const app = express();
app.use(cors());
app.use(express.json());

const API_KEY = 'add-your-api-key'; // Replace with your API key
const BASE_URL = 'https://api.commoditypriceapi.com/v2';

// Get latest commodity rates
app.get('/api/latest', async (req, res) => {
    try {
        const symbols = req.query.symbols || 'XAU,WTIOIL-FUT,XAG,BRENTOIL-FUT,NG-FUT';
        const quote = req.query.quote || 'USD';

        const response = await axios.get(`${BASE_URL}/rates/latest`, {
            headers: { 'x-api-key': API_KEY },
            params: { symbols, quote },
        });
        res.json(response.data);
    } catch (err) {
        console.error(err.response?.data || err.message);
        res.status(500).json({ error: 'Failed to fetch latest rates' });
    }
});

// Get timeseries data
app.get('/api/timeseries', async (req, res) => {
  try {
    const { symbols, startDate, endDate } = req.query;

    const response = await axios.get(`${BASE_URL}/rates/time-series`, {  // ✅ Correct
      headers: { 'x-api-key': API_KEY },
      params: { symbols, startDate, endDate },
    });

    res.json(response.data);
  } catch (err) {
    console.error('Timeseries API error:', err.response?.data || err.message);
    res.status(err.response?.status || 500).json({ error: err.response?.data || 'Failed to fetch timeseries data' });
  }
});


const PORT = 5000;
app.listen(PORT, () => console.log(`Server running on http://localhost:${PORT}`));
✅ Backend ready.
Setup Frontend
Open a new terminal → in main project folder:
npx create-react-app frontend
cd frontend
npm install axios chart.js react-chartjs-2
Create Components
Dashboard.js
import React, { useEffect, useRef, useState } from 'react';
import axios from 'axios';
import CommoditySelector from './CommoditySelector';
import TimeSeriesChart from './TimeSeriesChart';

/* ✅ Move constants OUTSIDE component */
const COLORS = ['#2563eb', '#dc2626', '#059669', '#7c3aed'];

const cardStyle = {
  background: '#ffffff',
  borderRadius: '14px',
  padding: '20px',
  boxShadow: '0 10px 30px rgba(0,0,0,0.06)'
};

const buttonStyle = {
  padding: '8px 14px',
  borderRadius: '6px',
  border: '1px solid #ddd',
  background: '#fff',
  cursor: 'pointer',
  fontSize: '0.85rem'
};

const Dashboard = () => {
  const [commodities, setCommodities] = useState(['XAU', 'WTIOIL-FUT']);
  const [latestRates, setLatestRates] = useState({});
  const [timeData, setTimeData] = useState({});
  const [datasets, setDatasets] = useState([]);
  const [startDate, setStartDate] = useState('2023-12-01');
  const [endDate, setEndDate] = useState('2023-12-31');
  const [loading, setLoading] = useState(false);

  const chartRef = useRef(null);

  /* Live prices */
  useEffect(() => {
    if (!commodities.length) return;

    axios
      .get(`http://localhost:5000/api/latest?symbols=${commodities.join(',')}`)
      .then(res => setLatestRates(res.data.rates || {}))
      .catch(console.error);
  }, [commodities]);

  /* Time series data */
  useEffect(() => {
    if (!commodities.length) return;

    setLoading(true);

    axios
      .get(`http://localhost:5000/api/timeseries`, {
        params: { symbols: commodities.join(','), startDate, endDate }
      })
      .then(res => {
        const raw = res.data.rates || {};
        const normalized = {};

        Object.entries(raw).forEach(([date, symbols]) => {
          Object.entries(symbols).forEach(([symbol, ohlc]) => {
            if (!normalized[symbol]) normalized[symbol] = {};
            normalized[symbol][date] = ohlc;
          });
        });

        setTimeData(normalized);
      })
      .finally(() => setLoading(false));
  }, [commodities, startDate, endDate]);

  /* Build chart datasets */
  useEffect(() => {
    const ds = Object.keys(timeData).map((symbol, index) => ({
      label: symbol,
      data: Object.entries(timeData[symbol]).map(([date, ohlc]) => ({
        x: date,
        y: ohlc?.close ?? null
      })),
      borderColor: COLORS[index % COLORS.length],
      backgroundColor: COLORS[index % COLORS.length],
      tension: 0.3,
      pointRadius: 2,
      spanGaps: true,
      yAxisID: symbol === 'XAU' ? 'yGold' : 'yOil'
    }));

    setDatasets(ds);
  }, [timeData]);

  const downloadChart = () => {
    if (!chartRef.current) return;

    const link = document.createElement('a');
    link.href = chartRef.current.toBase64Image();
    link.download = 'commodity-timeseries.png';
    link.click();
  };

  const exportCSV = () => {
    if (!Object.keys(timeData).length) return;

    const rows = [['Date', 'Commodity', 'Open', 'High', 'Low', 'Close']];

    Object.entries(timeData).forEach(([symbol, dates]) => {
      Object.entries(dates).forEach(([date, ohlc]) => {
        rows.push([date, symbol, ohlc.open, ohlc.high, ohlc.low, ohlc.close]);
      });
    });

    const csv = rows.map(r => r.join(',')).join('\n');
    const blob = new Blob([csv], { type: 'text/csv' });

    const link = document.createElement('a');
    link.href = URL.createObjectURL(blob);
    link.download = 'commodity-data.csv';
    link.click();
  };

  return (
    <div style={{
      padding: '30px',
      maxWidth: '1300px',
      margin: '0 auto',
      background: '#f4f6f8',
      minHeight: '100vh'
    }}>
      <h1 style={{ marginBottom: '25px' }}>Commodity Analytics Dashboard</h1>

      <section style={{ display: 'grid', gridTemplateColumns: '1fr 1fr', gap: '20px', marginBottom: '30px' }}>
        <div style={cardStyle}>
          <h3>Live Prices</h3>
          <div style={{ display: 'grid', gridTemplateColumns: '1fr 1fr', gap: '12px' }}>
            {Object.entries(latestRates).map(([symbol, price]) => (
              <div key={symbol} style={{ padding: '12px', border: '1px solid #eee', borderRadius: '8px' }}>
                <div style={{ fontSize: '0.8rem', color: '#666' }}>{symbol}</div>
                <div style={{ fontSize: '1.4rem', fontWeight: 600 }}>${price}</div>
              </div>
            ))}
          </div>
        </div>

        <div style={cardStyle}>
          <h3>Settings</h3>
          <CommoditySelector selected={commodities} setSelected={setCommodities} />

          <div style={{ marginTop: '15px', display: 'flex', gap: '12px' }}>
            <div>
              <label>Start Date</label>
              <input type="date" value={startDate} onChange={e => setStartDate(e.target.value)} />
            </div>
            <div>
              <label>End Date</label>
              <input type="date" value={endDate} onChange={e => setEndDate(e.target.value)} />
            </div>
          </div>
        </div>
      </section>

      <section style={cardStyle}>
        <div style={{ display: 'flex', justifyContent: 'space-between', marginBottom: '15px' }}>
          <h2>Historical Performance</h2>
          <div style={{ display: 'flex', gap: '10px' }}>
            <button style={buttonStyle} onClick={downloadChart}>Download Chart</button>
            <button style={buttonStyle} onClick={exportCSV}>Export CSV</button>
          </div>
        </div>

        {loading && <div>Updating chart...</div>}
        <TimeSeriesChart ref={chartRef} datasets={datasets} />
      </section>
    </div>
  );
};

export default Dashboard;
CommoditySelector.js
import React from 'react';

const CommoditySelector = ({ selected, setSelected }) => {
    const allCommodities = ['XAU', 'WTIOIL-FUT', 'XAG', 'BRENTOIL-FUT', 'NG-FUT'];

    const toggleCommodity = (symbol) => {
        if (selected.includes(symbol)) {
            setSelected(selected.filter(s => s !== symbol));
        } else {
            setSelected([...selected, symbol]);
        }
    };

    return (
        <div>
            <h3>Select Commodities</h3>
            {allCommodities.map(symbol => (
                <label key={symbol} style={{marginRight:'10px'}}>
                    <input
                        type="checkbox"
                        checked={selected.includes(symbol)}
                        onChange={() => toggleCommodity(symbol)}
                    />
                    {symbol}
                </label>
            ))}
        </div>
    );
}

export default CommoditySelector;
TimeSeriesChart.js
import React, { forwardRef } from 'react';
import { Line } from 'react-chartjs-2';
import {
  Chart as ChartJS,
  TimeScale,
  LinearScale,
  PointElement,
  LineElement,
  Title,
  Tooltip,
  Legend
} from 'chart.js';
import 'chartjs-adapter-date-fns';

ChartJS.register(
  TimeScale,
  LinearScale,
  PointElement,
  LineElement,
  Title,
  Tooltip,
  Legend
);

const TimeSeriesChart = forwardRef(({ datasets }, ref) => {
  if (!datasets || datasets.length === 0) {
    return <div style={{ textAlign: 'center', padding: '20px' }}>Waiting for data...</div>;
  }

  const data = { datasets };

  const options = {
    responsive: true,
    maintainAspectRatio: false,
    plugins: {
      legend: { position: 'top' },
      tooltip: { mode: 'nearest', intersect: false }
    },
    scales: {
      x: {
        type: 'time',
        time: { unit: 'day' },
        title: { display: true, text: 'Date' }
      },
      yGold: {
        type: 'linear',
        position: 'left',
        title: { display: true, text: 'Gold Price (USD)' }
      },
      yOil: {
        type: 'linear',
        position: 'right',
        grid: { drawOnChartArea: false },
        title: { display: true, text: 'Oil Price (USD)' }
      }
    }
  };

  return (
    <div style={{ height: '420px', width: '100%' }}>
      <Line ref={ref} data={data} options={options} />
    </div>
  );
});

export default TimeSeriesChart;
App.js
import React from 'react';
import Dashboard from './components/Dashboard';

function App() {
  return (
    <div style={{ padding: '20px', fontFamily: 'Arial' }}>
      <h1>Commodity Time Series Dashboard</h1>
      <p>View latest prices and historical charts for commodities.</p>
      <Dashboard />
    </div>
  );
}

export default App;
Run the App
Start backend:
cd backend
node index.js
Start frontend:
cd ../frontend
npm start
Open browser: http://localhost:3000
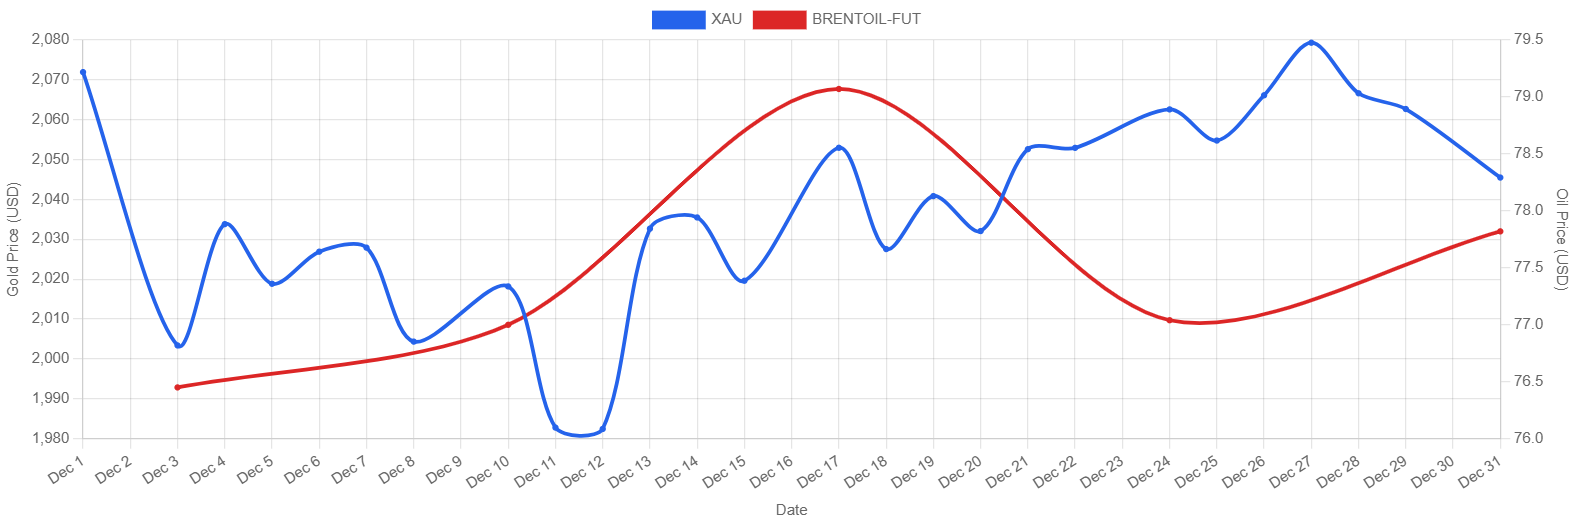
✅ You should see latest commodity prices, a commodity selector, date pickers, and a time series chart.
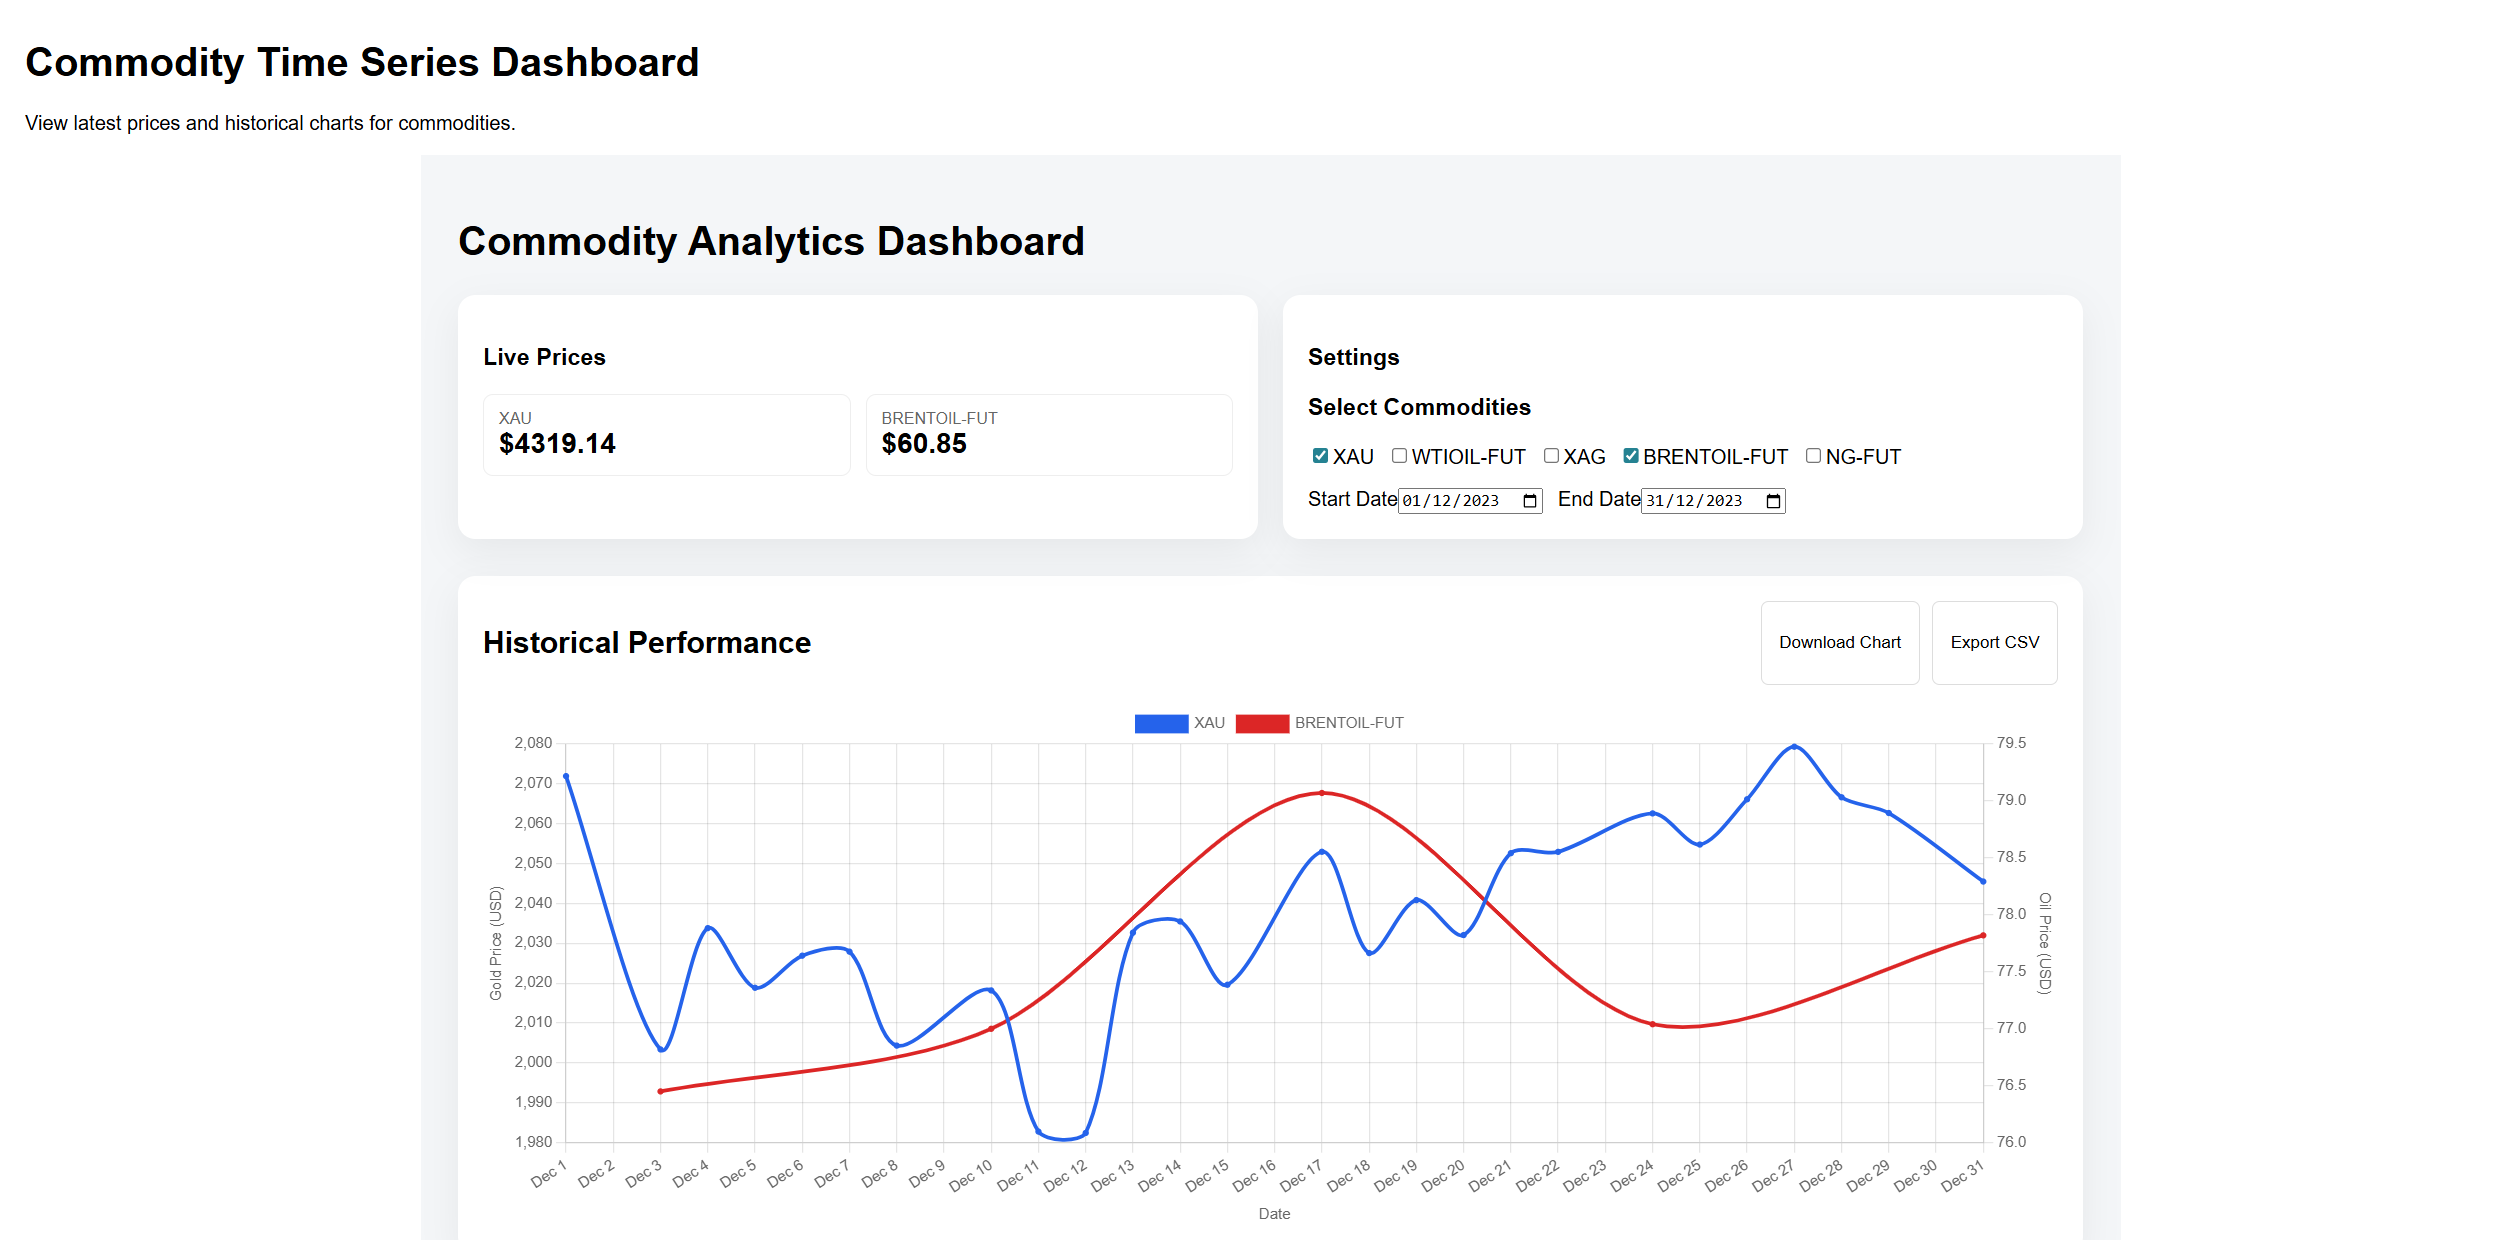
There is also a download and export button at the top right corner of the chart. Here is the downloaded chart.
Access the Complete Code Here.
Practical Use Cases of Commodity Time-Series Analysis
Traders follow trends to choose entry and exit points in commodity stock prices. Businesses hedge fuel and material costs to stay safe from sudden jumps. Analysts study patterns over time and share what they mean.
Manufacturers rely on forecasts for budgeting. Financial teams manage exposure using futures and commodities trading data. Planning improves when uncertainty is reduced.
Time-series analysis turns raw numbers into insight. It supports a better strategy. Decisions become more grounded.
Conclusion
Historical context changes how markets are understood. Oil and gold trends show clear cycles and stress points in commodity trading live. Seeing these patterns helps people think more clearly. It makes decisions feel more grounded and confident.
Reliable data support accurate conclusions when using current futures market prices. Poor inputs distort the analysis quickly. Trusted sources reduce that risk.
CommodityPriceAPI supports both live tracking and historical study. Past and present work best together. You gain better insight when the data stays reliable.
FAQs
What Is a Real Time Commodity Prices API?
It helps you in knowing the current and historical pricing data for assets like oil and gold through structured access.
Can CommodityPriceAPI Be Used for Historical Commodity Analysis?
Yes, it offers time-series data suitable for long-term study.
Why Is Time-Series Analysis Important for Commodities?
It reveals cycles, volatility, and reactions to global events.
How Accurate Is API-Based Commodity Data?
API-based commodity data is usually very reliable. It updates regularly and avoids the errors that often come with manual checks or scraped sources.
Who Benefits Most From This Analysis?
Traders, analysts, researchers, and businesses are exposed to commodity trading today.