Gold, Oil, And Corn At Your Fingertips Using A Free Commodity Prices API
By
Ejaz Ahmed30 Dec 2025 • 8 min read

Commodity prices play a constant role in daily economic decisions. Gold tracks shifts in market sentiment, oil impacts transport expenses, and corn highlights food supply pressure. With a free commodities price api, these changes are easier to monitor as markets react.
Accessing this data has not always been easy. Many teams rely on scattered sources or delayed updates that break analysis. A free commodity prices api changes that dynamic.
This is where CommodityPriceAPI fits in. It offers clean access to live and historical prices through a simple interface. You get clarity without friction.
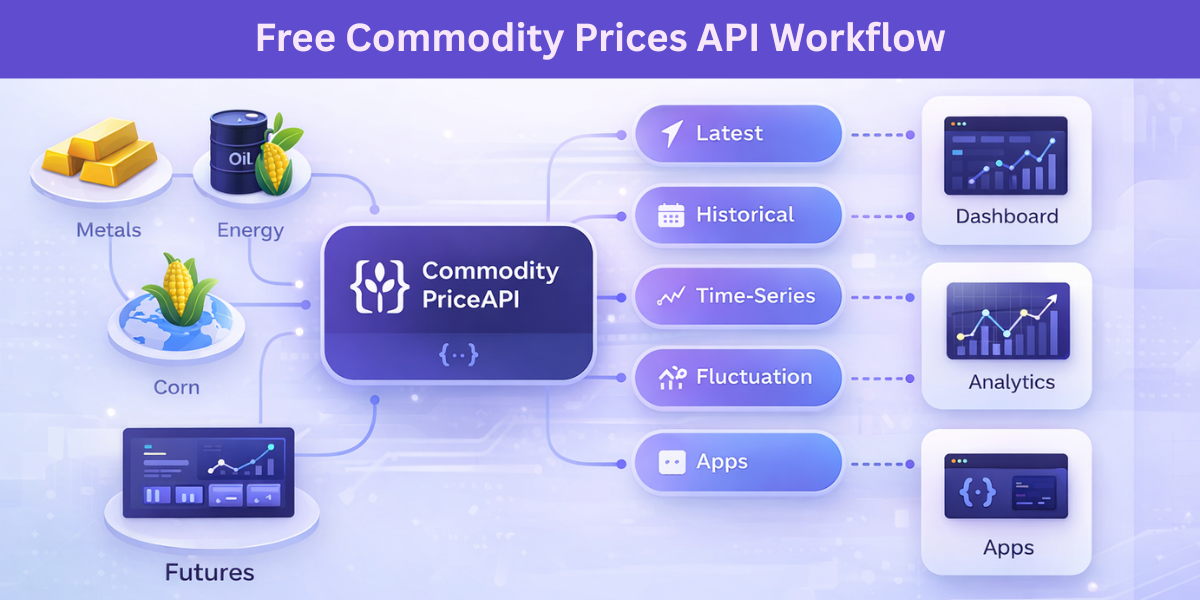
What Is CommodityPriceAPI
CommodityPriceAPI is a REST-based JSON service for commodity pricing. It covers metals, energy, including natural gas, agriculture, and futures in one place. You query prices and receive structured data instantly, making it easy to work with real time commodity prices.
The API supports more than 130 commodities. Historical data goes back to 1990 for most symbols. That depth helps teams study long-term behavior using reliable financial data.
Developers use it as a free api for commodity prices during testing. Analysts rely on it for trend checks and reporting. Products use this commodities api to power real features.
Core Commodities Explained: Gold, Oil, And Corn
Gold As A Global Financial Anchor
Gold remains a trusted store of value across global markets. Investors tend to watch gold more closely during periods of inflation and sharp currency swings. Central banks still treat it as a reserve asset.
Real-time gold prices reveal sudden shifts as they happen. Historical gold data explains how markets reacted during past crises. This real time and historical view matters when building reliable models.
A commodity price api free option makes this access simple. You can track gold without heavy data costs. That opens doors for smaller teams.
Oil As A Real-Time Economic Signal
Oil prices move fast and affect everything. Transport, manufacturing, and energy planning depend on them, especially when crude oil costs shift suddenly. Even small changes ripple through markets.
WTI and Brent serve different regions. Tracking both helps compare exchange rates across global energy markets. That context makes price movement easier to read.
Using a free commodity price api simplifies access. You can track the closing price without scraping or manual updates. Systems stay current with less effort.
Corn As A Key Agricultural Indicator
Corn prices reflect supply health across agricultural commodities. Weather changes, fuel demand, and export levels all play a role. That makes corn a strong signal for wider market movement.
Seasonal patterns matter in agriculture. Historical corn prices reveal cycles and anomalies tied to agricultural products. This insight supports better planning and forecasting.
Developers use corn data in agri-tech tools. Analysts include it in food inflation models. A free commodities price api lowers entry barriers for both.
How CommodityPriceAPI Delivers Real-Time Data
CommodityPriceAPI uses a simple REST structure that works smoothly across common programming languages. Requests return clean JSON with prices and metadata. It is easy to read and simple to work with.
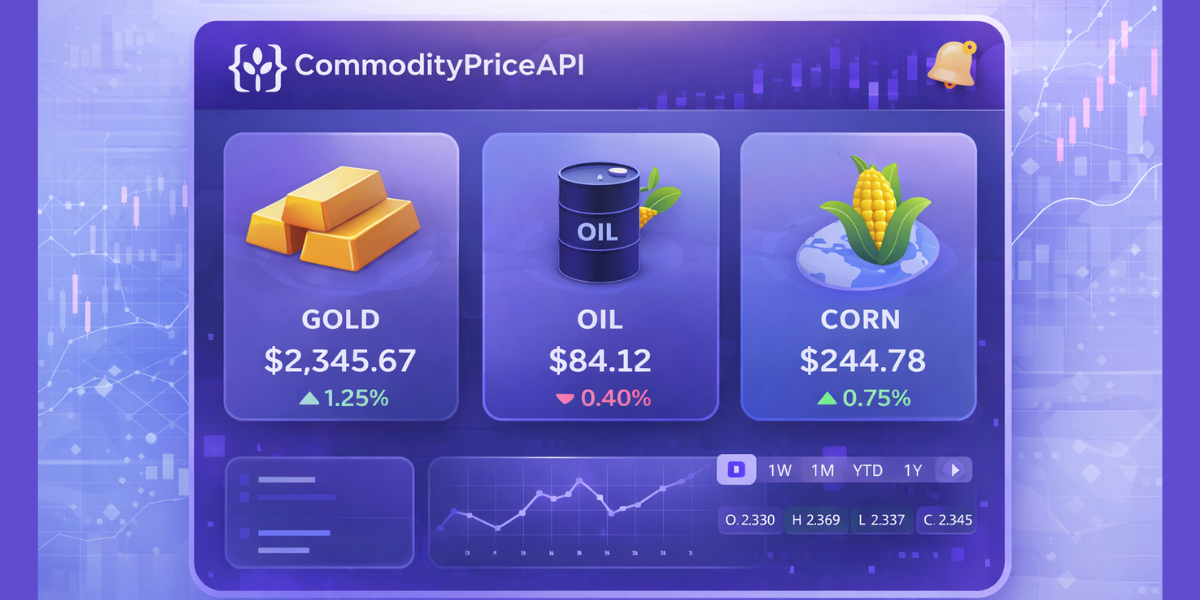
The Latest Rates endpoint provides current prices for commodities, including precious metals. Update speed depends on your plan. Some users see minute-level refreshes.
Each response includes timestamps and units. Symbols stay consistent across endpoints. That consistency reduces integration errors.
Example Request:
Curl
curl -X GET "https://api.commoditypriceapi.com/v2/rates/latest?apiKey=YOUR_API_KEY&symbols=XAU,WTIOIL-FUT,XAG"
Python
import requests

url = "https://api.commoditypriceapi.com/v2/rates/latest"
params = {
    "apiKey": "YOUR_API_KEY",
    "symbols": "XAU,WTIOIL-FUT,XAG"
}
response = requests.get(url, params=params)
data = response.json()
print(data)
JavaScript (fetch)
fetch("https://api.commoditypriceapi.com/v2/rates/latest?apiKey=YOUR_API_KEY&symbols=XAU,WTIOIL-FUT,XAG")
  .then(response => response.json())
  .then(data => console.log(data));
Sample Response:
{
  "success": true,
  "timestamp": 1767092760,
  "rates": {
    "XAU": 4386.18,
    "WTIOIL-FUT": 58.43,
    "XAG": 74.64
  },
  "metadata": {
    "XAU": {"unit": "T.oz", "quote": "USD"},
    "WTIOIL-FUT": {"unit": "Bbl", "quote": "USD"},
    "XAG": {"unit": "T.oz", "quote": "USD"}
  }
}
Supported Symbols And Commodity Coverage
The Symbols endpoint lists every supported commodity across all api endpoints. Each symbol includes unit and quote currency details. This avoids guesswork.
The API supports commodities across metals, energy, agriculture, and gas. Futures symbols are clearly marked for accuracy. Coverage expands as new data becomes available.
You can fetch symbols programmatically and pair them with data like the opening price when needed. This helps dynamic systems adapt automatically. It also supports discovery workflows.
Example Request:
Curl
curl -X GET "https://api.commoditypriceapi.com/v2/symbols?apiKey=YOUR_API_KEY"
Python
import requests

url = "https://api.commoditypriceapi.com/v2/symbols"
params = {"apiKey": "YOUR_API_KEY"}
response = requests.get(url, params=params)
print(response.json())
Sample Response:
{
  "success": true,
  "symbols": {
    "XAU": {"name": "Gold", "category": "Metals", "unit": "T.oz", "quote": "USD"},
    "WTIOIL-FUT": {"name": "WTI Oil Futures", "category": "Energy", "unit": "Bbl", "quote": "USD"},
    "XAG": {"name": "Silver", "category": "Metals", "unit": "T.oz", "quote": "USD"}
  }
}
Historical Commodity Prices Back To 1990
Historical data gives context to price moves. Without history, trends stay unclear for any given commodity. Long records add confidence.
CommodityPriceAPI provides daily historical prices. Most symbols go back to January 1990, making it easier to spot the lowest price across long time ranges. That range supports serious analysis.
OHLC data is provided whenever it is available. For monthly commodities, the API returns only the closing value. The API handles gaps cleanly.
Example Request:
Curl
curl -X GET "https://api.commoditypriceapi.com/v2/rates/historical?apiKey=YOUR_API_KEY&symbols=XAU&date=2025-12-30"
Python
import requests

url = "https://api.commoditypriceapi.com/v2/rates/historical"
params = {
    "apiKey": "YOUR_API_KEY",
    "symbols": "XAU",
    "date": "2025-12-30"
}
response = requests.get(url, params=params)
print(response.json())
Sample Response:
{
  "success": true,
  "date": "2025-12-30",
  "rates": {
    "XAU": {"open": 4380.00, "high": 4390.50, "low": 4375.00, "close": 4386.18}
  }
}
Time-Series Data For Trend Analysis
The Time-Series endpoint provides daily prices for a selected date range. It supports charts, backtests, and systems that depend on live data. Queries stay predictable.
Date ranges can span up to one year. This keeps responses fast and stable. Longer ranges can be split easily without breaking analysis.
Analysts use this for trend detection across markets. Developers use it for dashboards built for financial institutions. It fits many workflows.
Example Request:
Curl
curl -X GET "https://api.commoditypriceapi.com/v2/rates/timeseries?apiKey=YOUR_API_KEY&symbols=XAU,WTIOIL-FUT&startDate=2025-12-01&endDate=2025-12-30"
Python
import requests

url = "https://api.commoditypriceapi.com/v2/rates/timeseries"
params = {
    "apiKey": "YOUR_API_KEY",
    "symbols": "XAU,WTIOIL-FUT",
    "startDate": "2025-12-01",
    "endDate": "2025-12-30"
}
response = requests.get(url, params=params)
print(response.json())
Sample Response:
{
  "success": true,
  "startDate": "2025-12-01",
  "endDate": "2025-12-30",
  "rates": {
    "XAU": {
      "2025-12-01": 4370.00,
      "2025-12-30": 4386.18
    },
    "WTIOIL-FUT": {
      "2025-12-01": 56.50,
      "2025-12-30": 58.43
    }
  }
}
Tracking Price Changes With The Fluctuation Endpoint
Fluctuation data focuses on change. You provide start and end dates, along with your x api key, and the API calculates the difference. The process stays simple and predictable.
Responses include startRate and endRate. You also see change, changePercent, and the highest price recorded within the range. These values are easy to interpret.
Example Request:
Curl
curl -X GET "https://api.commoditypriceapi.com/v2/rates/fluctuation?apiKey=YOUR_API_KEY&symbols=XAU&startDate=2025-12-01&endDate=2025-12-30"
Python
import requests

url = "https://api.commoditypriceapi.com/v2/rates/fluctuation"
params = {
    "apiKey": "YOUR_API_KEY",
    "symbols": "XAU",
    "startDate": "2025-12-01",
    "endDate": "2025-12-30"
}
response = requests.get(url, params=params)
print(response.json())
Sample Response:
{
  "success": true,
  "startDate": "2025-12-01",
  "endDate": "2025-12-30",
  "rates": {
    "XAU": {
      "startRate": 4370.00,
      "endRate": 4386.18,
      "change": 16.18,
      "changePercent": 0.37
    }
  }
}
Custom Quote Currencies And Global Pricing
Not all teams work in USD. Local pricing becomes important for global products when tracking a single commodity name across different regions. Currency flexibility helps.
CommodityPriceAPI offers support for over 175 quote currencies. That means you can view prices in local terms for metals, agriculture, and energy products. Reporting becomes easier to manage.
A commodity price api free tier still supports defaults. Paid plans unlock full currency control. Scaling stays smooth.
Authentication And API Key Management
Authentication uses API keys linked to your account. You pass the key in headers or query parameters. Setup is quick.
Keys should stay server-side. Exposing them in browsers is risky, especially for traders running live systems. Basic hygiene prevents misuse.
The dashboard shows usage stats for your account. Quotas update in real time. Monitoring stays simple.
Error Handling And Rate Limits
Errors follow standard HTTP codes. Responses include clear messages, even when requests hit the latest endpoint. Debugging stays fast.
Missing symbols and wrong dates are common slip-ups. Rate limits may slow things down for a moment across the world. The feedback is easy to understand.
Retry logic improves reliability. Short delays work best. Clear errors help systems recover.
Pricing Plans And Scalability Options
CommodityPriceAPI provides Lite, Plus, and Premium plans. Each plan unlocks higher limits and faster updates, allowing teams to start with a free api for commodity prices and scale smoothly.
Lite works well for testing. Plus fits production apps. Premium supports heavy workloads, even when teams rely on a commodity price api free option during early development.
You can upgrade anytime. No long contracts block growth. Scaling stays flexible.
Common Use Cases For Developers And Teams
Many teams build price dashboards. Others automate alerts for price moves. Some feed data into analytics pipelines.
Fintech tools track metals and energy. Agri-tech platforms monitor crops. Energy firms watch oil and gas.
A free commodity prices api helps early stages. Paid plans support growth. The path stays clear.
Why CommodityPriceAPI Fits Modern Workflows
Integration takes minutes with a free commodity price api that keeps setup simple. Endpoints stay consistent. JSON responses remain clean.
Data sources are reliable, which is key when using a free commodities price api in real systems. Formats do not shift unexpectedly. This builds trust.
Teams spend less time fixing data. They focus on logic and insights instead. That balance matters.
Getting Started With CommodityPriceAPI
To get started with the Commodity prices API, you must have an account on their website.
Once you have an account, you can log in to see the dashboard.
On the dashboard, you can see your API key. There will also be a section on tracking the API usage. For your reference, we have also attached a screenshot:
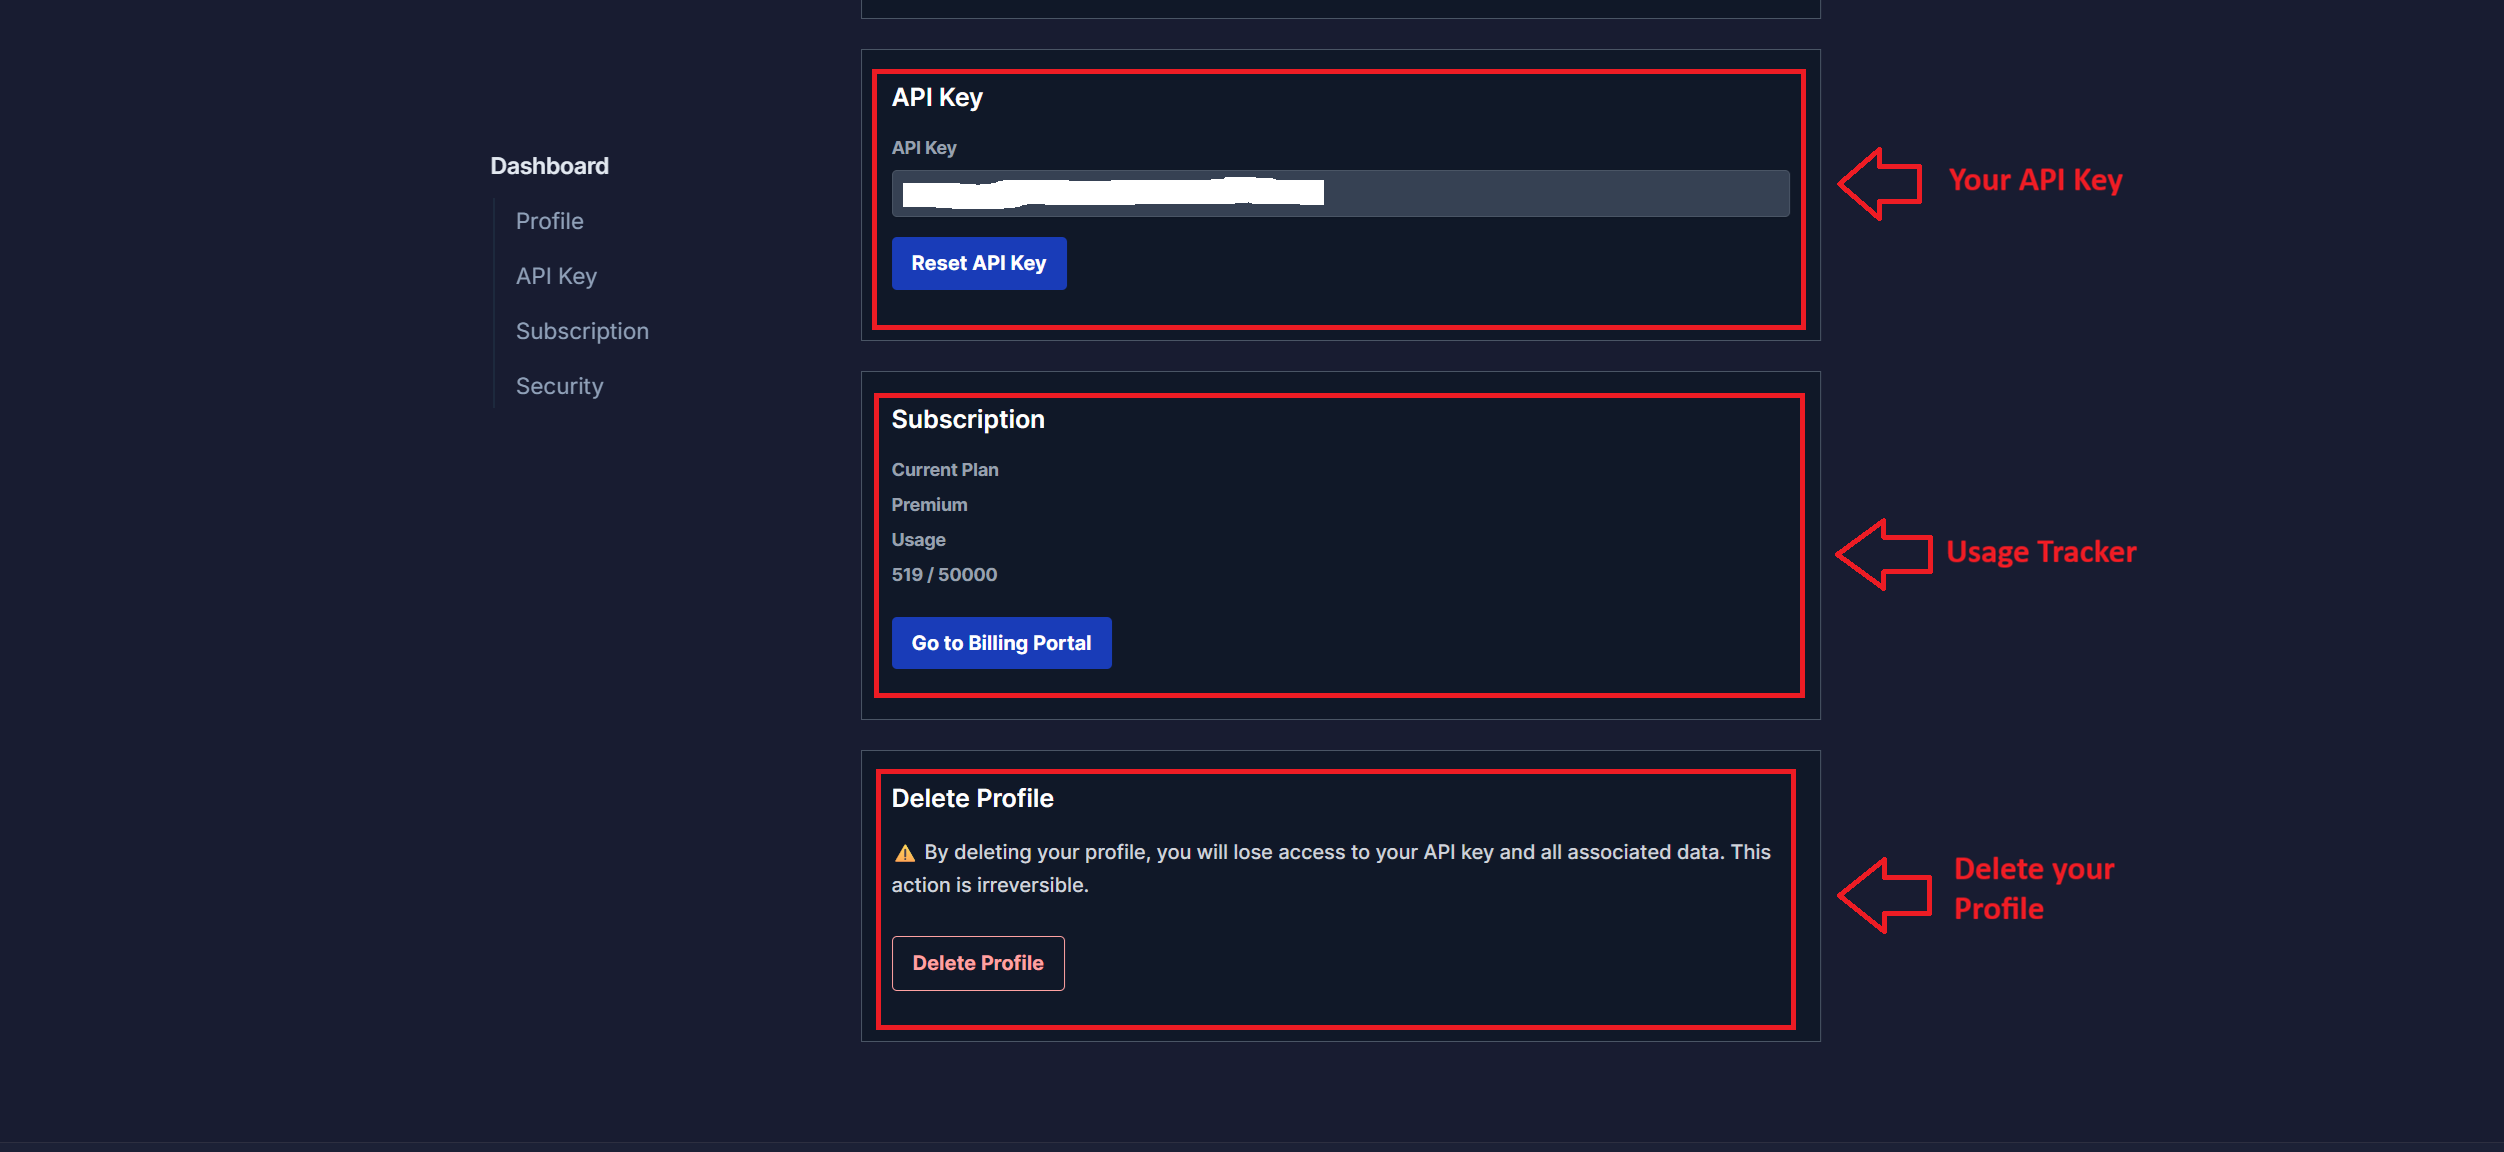
From the last option, you can also delete your profile if the API doesn't suit your requirements.
Once you have the API key, you can navigate to the documentation page to explore all the given commodity endpoints:
https://commoditypriceapi.com/#documentation Make sure that you test the endpoints before integrating them into your apps. Postman is a good tool for testing API endpoints.
Happy coding!
Conclusion
Commodity pricing no longer needs to feel distant. Gold, oil, and corn data are now easy to reach, alongside markets like live cattle futures, heating oil, and palm oil. Clear APIs remove friction and keep access simple.
Reliable pricing supports better decisions. History gives price moves meaning and builds confidence. Real-time data keeps systems alert, especially when powered by a free commodity price api.
A free api for commodity prices helps teams start. CommodityPriceAPI helps them grow. Access stays in your hands.
FAQs
What Commodities Are Supported By CommodityPriceAPI?
The API supports over 130 commodities. It covers metals, energy, agriculture, and futures, with new markets added over time.
How Far Back Does Historical Commodity Data Go?
Most commodities include data back to January 1, 1990. This supports long-term analysis. Some symbols may vary.
Can I Use CommodityPriceAPI With A Free Trial?
Yes, the free trial does not require a credit card. You can test endpoints freely. Limits apply, but access is real.
How Often Are Commodity Prices Updated?
Update speed depends on your plan. Lite updates may be delayed. Plus and Premium offer faster refresh rates.
Can I Request Commodity Prices In Non-USD Currencies?
Yes. You can pull prices in more than 175 currencies. It suits teams worldwide and keeps currency swaps simple.