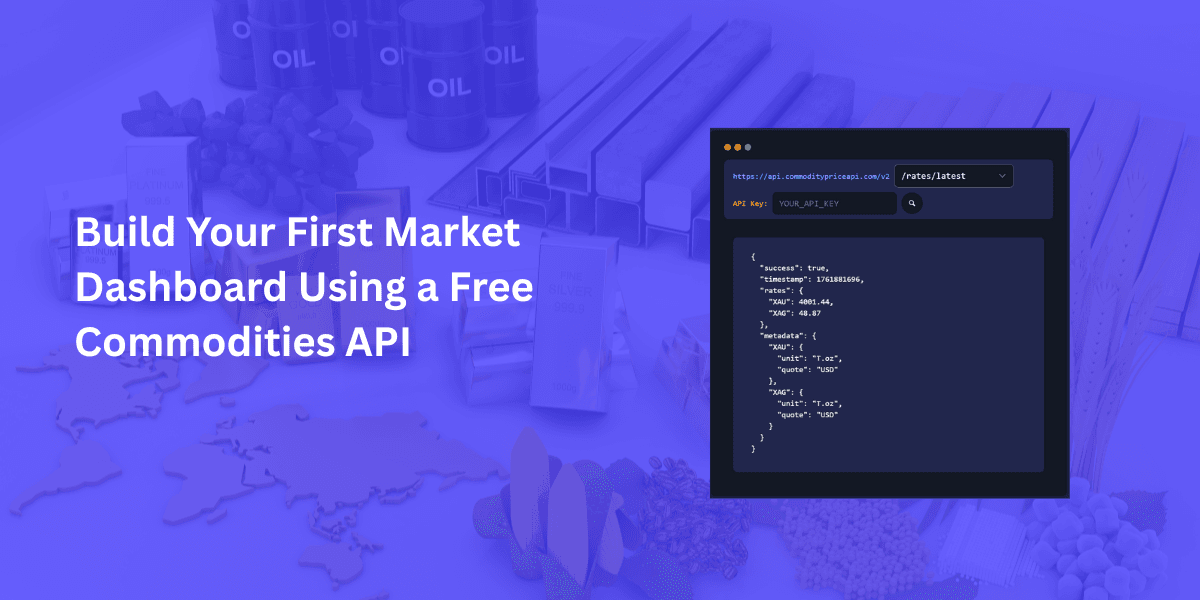
Build Your First Market Dashboard Using a Free Commodities API
By
Ejaz Ahmed12 Dec 2025 • 10 min read
Tracking the prices of commodities can be really difficult if you do it manually. Prices change in seconds and minutes. When you miss the trend then it will impact your money. Did you know that the traders, analysts, and developers need what? All they need is a fast and reliable solution.
This is where the free commodities API, like CommodityPriceAPI, comes in. They give you real-time prices in simple and JSON format. With the help of this data, you can easily build automatically updating dashboards.
In the blog, we will talk about how to fetch live prices for gold, silver, and oil etc. We will also see how to create a dashboard layout, add real time and historical charts, and automate the updates. So let’s get started.
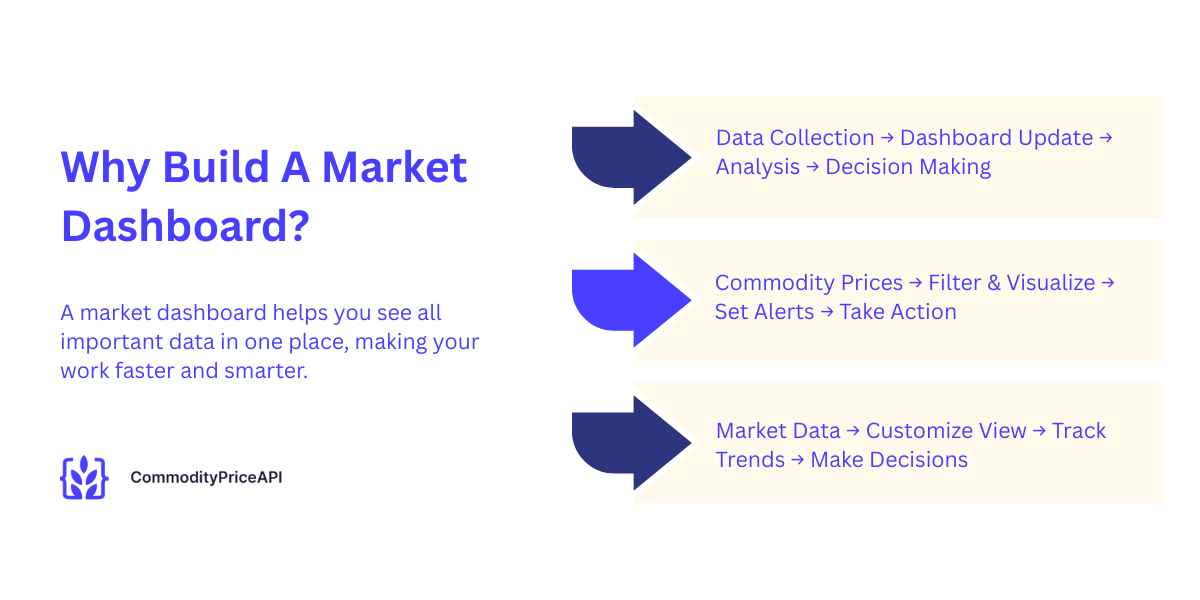
Why Build A Market Dashboard?
A historical commodity prices market dashboard centralizes all your information including exchange rate data. It saves human time, reduces errors, and improves the process of decision-making. Let’s explore why you should use them and why they are important.
Real-Time Decision Making
Commodity prices are moving quickly. A few minutes can change all your trading decisions. Dashboards display the change prices instantly. This thing allows you to react immediately. Traders, analysts, and students get the most benefit from this.
Easy To Automate And Customize
Dashboards are very flexible, and you can filter commodities, currencies, or timeframes with them. You can also add alerts, charts, and visualize the trends. Customize everything to that is according to the needs of your work and learning style.
Faster Than Manual Market Tracking
Stop using different websites for historical commodity prices; it's old now. A single dashboard gives you all the data according to your needs. This saves your time and reduces errors. With this, you can track trends efficiently.
What Is A Free Commodities API?
A lightweight open source API gives you well-structured market data. CommodityPriceAPI is the best and most popular option. It covers over 130 commodities it also including metals, energy, agriculture, and industrial goods.
Simple JSON Data
The free commodities API gives you clean and easy-to-read JSON responses. Here is an example of JSON format.
{

  "success": true,

  "timestamp": 1764044175,

  "rates": {

    "XAU": 4146.18,

    "WTIOIL-FUT": 58.66,

    "XAG": 51.56,

    "BRENTOIL-FUT": 63.12,

    "NG-FUT": 4.63

  }

}
You can put this data directly into your app and dashboard.
Covers 130+ Commodities
- It covers precious metals like gold and silver
- It covers energy resources like oil and natural gas
- It covers agricultural goods such as wheat, corn, and soy
- It covers industrial metals like copper and aluminum
Free Commodities API Tier Available
It gives you an unlimited free Commodities API trial. No credit card or debit card data is required. Get your API key instantly from the dashboard after signing in.
Step 1: Get Your Free Commodities API Key
Create An Account
Create an account on CommodityPriceAPI. Sign up with your email or continue with your Gmail account. You don’t need a credit card. The onboarding process is fast and simple with CommodityPriceAPI.
Generate API Key
Use your API key to authenticate the requests. Two options are available:
- Query parameter: apiKey=YOUR_API_KEY
- Header: x-api-key: YOUR_API_KEY
Keep It Secure
Never share your API key with client-side JavaScript or anyone. Instead of using your API key, use environmental variables and backend codes.
Step 2: Fetch Real-Time Commodity Data
Let's get started with some intuitive code examples to get fluctuation data:
API Endpoint
Use this endpoint:
https://api.commoditypriceapi.com/v2/rates/latestExample Request
https://api.commoditypriceapi.com/v2/rates/latest?apiKey=YOUR_API_KEY&symbols=XAU,XAG,WTIOIL-FUTResponse Breakdown
- Success
It indicates if the API call worked
- Timestamp
It gives you the Unix time of the response
- Rates
It gives the current prices of your selected commodities
- Metadata
Gives you Units and quote currency
Step 3: Choose The Free Commodities API For Your Dashboard
Most Popular Commodities
- Gold symbol is XAU
- Silver symbol is XAG
- Brent Oil symbol is BRENTOIL-FUT
- WTI Oil symbol is WTIOIL-FUT
- Natural Gas symbol is NG-FUT
Recommended For Beginners
If you are a beginner, then start with 3 to 5 commodities. Keep your dashboard simple. You can expand your dashboard later.
Commodity Reference Table
Commodity | Symbol | Unit | Example Price (USD) |
Gold | XAU | T.oz | 4150.06 |
Silver | XAG | T.oz | 51.88 |
WTI Oil | WTIOIL-FUT | Bbl | 58.21 |
Brent Oil | BRENTOIL-FUT | Bbl | 62.74 |
Natural Gas | NG-FUT | MMBtu | 4.53 |
Step 4: Build The Dashboard Layout
Recommended Sections
- Header: “Live Commodity Dashboard”
- Real-time commodity prices cards
- Historical trend chart
- Date filters
- Currency selector
Design Options
You have a different choice, choose them according to your needs.
- HTML + CSS is for a simple static dashboard
- React or Vue for modern is for dynamic apps
- No-code tools like Bubble or Retool is used for quick setup
Step 5: Display Real-Time Prices
Simple JavaScript Example
const url = "https://api.commoditypriceapi.com/v2/rates/latest?apiKey=YOUR_API_KEY&symbols=XAU,XAG,WTIOIL-FUT";

fetch(url)

  .then(res => res.json())

  .then(data => {

    console.log("Gold Price:", data.rates.XAU);

    console.log("Silver Price:", data.rates.XAG);

    console.log("WTI Oil:", data.rates["WTIOIL-FUT"]);

  });
Update Prices Automatically
Use setInterval() to refresh every 60 seconds. Because of this, your dashboard is live.
Step 6: Add Historical Charts
Historical Endpoint
Use /rates/historical to fetch historical prices.
Time-Series Endpoint
Query the API for daily historical data. This is best option for trend analysis.
Use Chart Libraries
- Use Chart.js
- Use ECharts
- Use Highcharts
Step 7: Add Currency Conversion (Optional)
Supported Currencies
It converts prices to 175+ currencies. Such as USD, EUR, GBP, PKR, AED, JPY
Example Request
...?symbols=XAU"e=EUR
Step 8: Handle Errors And Limits
Common Errors
- Your API key is not found.
- Your symbol is not found.
- Too many requests.
- Your limit is reached.
These are some common errors. In another section, we will discuss how to avoid them.
How To Avoid Issues
- Cache API responses.
- You can combine multiple symbols into a single request.
- Upgrade your plan if it is necessary.
Step 9: Deploy Your Dashboard
Hosting Options
- Netlify
- Vercel
- GitHub Pages
- Any cloud VM
For Enterprise Teams
Integrate dashboards with internal systems or BI tools.
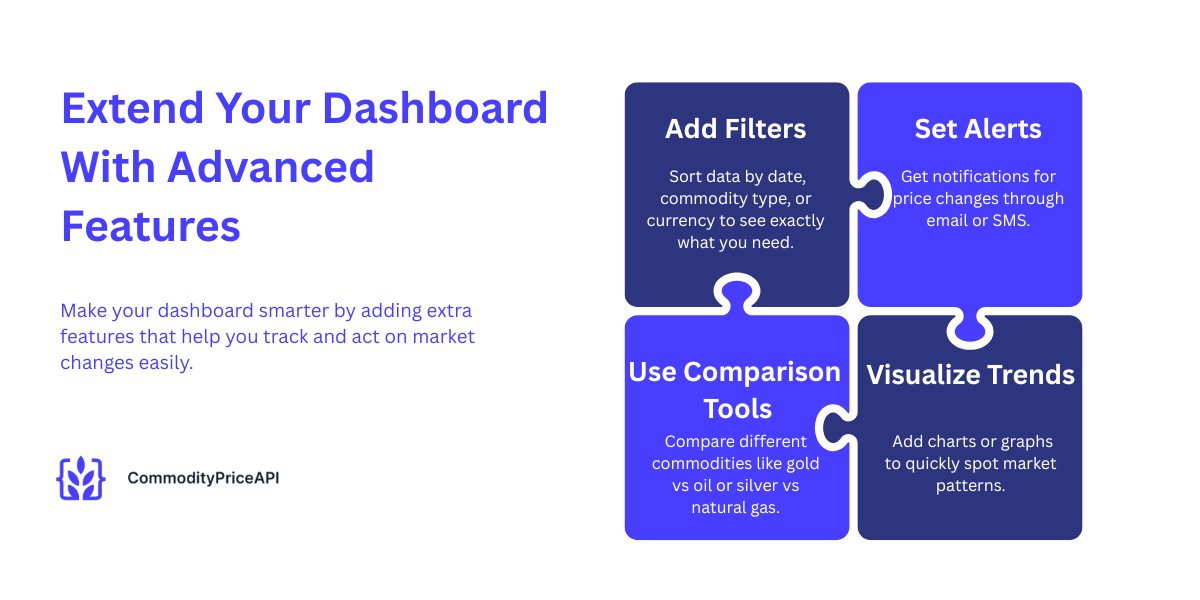
Step 10: Extend Your Dashboard With Advanced Features
Add Filters
- Add filters such as start and end date or date range
- Commodity groups
- Quote currency
Add Alerts
- Price drop alerts
- Email/SMS notifications
- Alerts of market.
Add Comparison Tools
Compare gold vs oil, silver vs natural gas, and more.
Complete Working Code:
<!DOCTYPE html>
<html lang="en">
<head>
<meta charset="UTF-8">
<meta name="viewport" content="width=device-width, initial-scale=1.0">
<title>Commodity Dashboard</title>
<script src="https://cdn.jsdelivr.net/npm/chart.js"></script>
<style>
body { font-family: Arial; background: #eef1f5; padding: 20px; }
h1 { text-align: center; margin-bottom: 30px; }
.section {
background: #fff; padding: 20px; margin-top: 25px;
border-radius: 10px; box-shadow: 0 2px 8px rgba(0,0,0,0.2);
}
.filters {
display: flex; gap: 20px; margin-bottom: 15px;
}
select, input {
padding: 8px; border-radius: 5px; border: 1px solid #aaa;
}
.card-container {
display: flex; gap: 20px; flex-wrap: wrap; justify-content: center;
}
.card {
background: #fff; width: 200px; padding: 20px;
border-radius: 10px; text-align: center;
box-shadow: 0 2px 5px rgba(0,0,0,0.2);
}
</style>
</head>
<body>
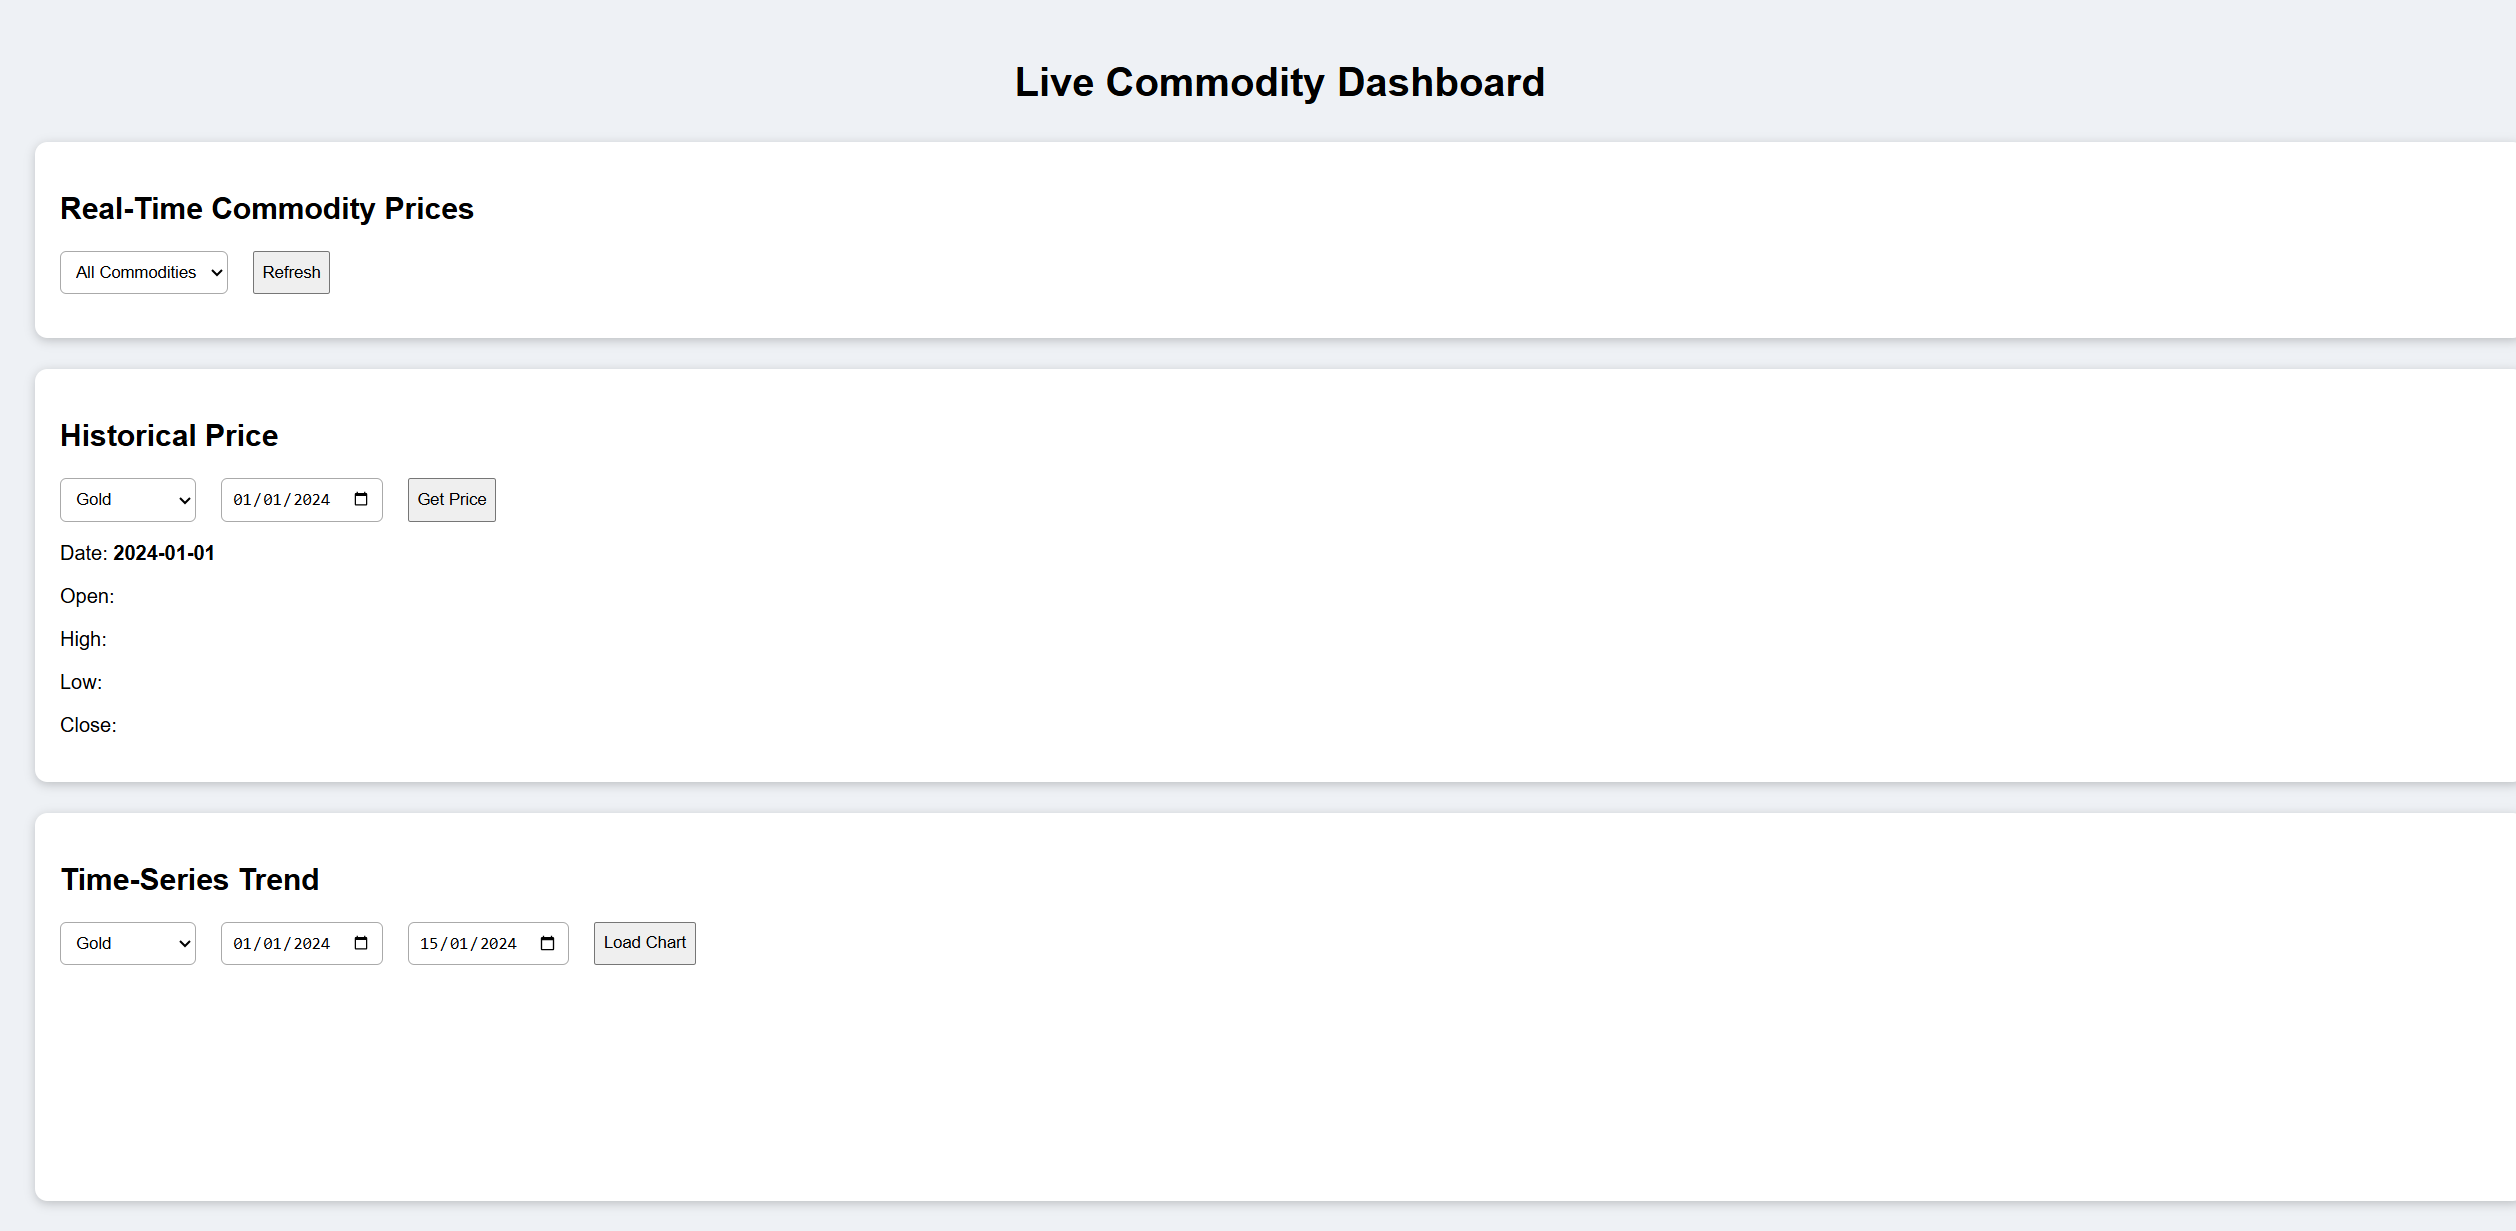
<h1>Live Commodity Dashboard</h1>
<div class="section">
<h2>Real-Time Commodity Prices</h2>
<div class="filters">
<select id="latestSymbols">
<option value="XAU,XAG,WTIOIL-FUT,BRENTOIL-FUT,NG-FUT">All Commodities</option>
<option value="XAU">Gold (XAU)</option>
<option value="XAG">Silver (XAG)</option>
<option value="WTIOIL-FUT">WTI Oil</option>
<option value="BRENTOIL-FUT">Brent Oil</option>
<option value="NG-FUT">Natural Gas</option>
</select>
<button onclick="loadLatest()">Refresh</button>
</div>
<div id="priceCards" class="card-container"></div>
</div>
<!-- Historical section -->
<div class="section">
<h2>Historical Price</h2>
<div class="filters">
<select id="histSymbol">
<option value="XAU">Gold</option>
<option value="XAG">Silver</option>
<option value="WTIOIL-FUT">WTI Oil</option>
<option value="BRENTOIL-FUT">Brent Oil</option>
<option value="NG-FUT">Natural Gas</option>
</select>
<input type="date" id="histDate" value="2024-01-01">
<button onclick="loadHistorical()">Get Price</button>
</div>
<p>Date: <strong id="historicalDate"></strong></p>
<p>Open: <strong id="hOpen"></strong></p>
<p>High: <strong id="hHigh"></strong></p>
<p>Low: <strong id="hLow"></strong></p>
<p>Close: <strong id="hClose"></strong></p>
</div>
<!-- Time series section -->
<div class="section">
<h2>Time-Series Trend</h2>
<div class="filters">
<select id="tsSymbol">
<option value="XAU">Gold</option>
<option value="XAG">Silver</option>
<option value="WTIOIL-FUT">WTI Oil</option>
<option value="BRENTOIL-FUT">Brent Oil</option>
<option value="NG-FUT">Natural Gas</option>
</select>
<input type="date" id="startDate" value="2024-01-01">
<input type="date" id="endDate" value="2024-01-15">
<button onclick="loadTimeSeries()">Load Chart</button>
</div>
<canvas id="timeSeriesChart"></canvas>
</div>
<script>
const BASE = "https://api.commoditypriceapi.com/v2";
const API_KEY = "YOUR_API_KEY";
// Latest Prices
function loadLatest() {
const symbols = document.getElementById("latestSymbols").value;
fetch(`${BASE}/rates/latest?apiKey=${API_KEY}&symbols=${symbols}`)
.then(r => r.json())
.then(data => {
const box = document.getElementById("priceCards");
box.innerHTML = "";
Object.entries(data.rates).forEach(([sym, price]) => {
box.innerHTML += `
<div class="card">
<h3>${sym}</h3>
<p><strong>${price}</strong> USD</p>
</div>
`;
});
});
}
loadLatest();
// Historical Price
function loadHistorical() {
const symbol = document.getElementById("histSymbol").value;
const date = document.getElementById("histDate").value;
document.getElementById("historicalDate").innerText = date;
fetch(`${BASE}/rates/historical?apiKey=${API_KEY}&symbols=${symbol}&date=${date}`)
.then(r => r.json())
.then(data => {
const v = data.rates[symbol];
document.getElementById("hOpen").innerText = v.open;
document.getElementById("hHigh").innerText = v.high;
document.getElementById("hLow").innerText = v.low;
document.getElementById("hClose").innerText = v.close;
});
}
loadHistorical();
// Time Series Chart
let chart;
function loadTimeSeries() {
const symbol = document.getElementById("tsSymbol").value;
const start = document.getElementById("startDate").value;
const end = document.getElementById("endDate").value;
fetch(`${BASE}/rates/time-series?apiKey=${API_KEY}&symbols=${symbol}&startDate=${start}&endDate=${end}`)
.then(r => r.json())
.then(data => {
const labels = Object.keys(data.rates);
const closePrices = labels.map(d => data.rates[d][symbol].close);
if (chart) chart.destroy();
const ctx = document.getElementById("timeSeriesChart").getContext("2d");
chart = new Chart(ctx, {
type: "line",
data: {
labels,
datasets: [{
label: `${symbol} Close Price`,
data: closePrices,
borderWidth: 3
}]
}
});
});
}
loadTimeSeries();
</script>
</body>
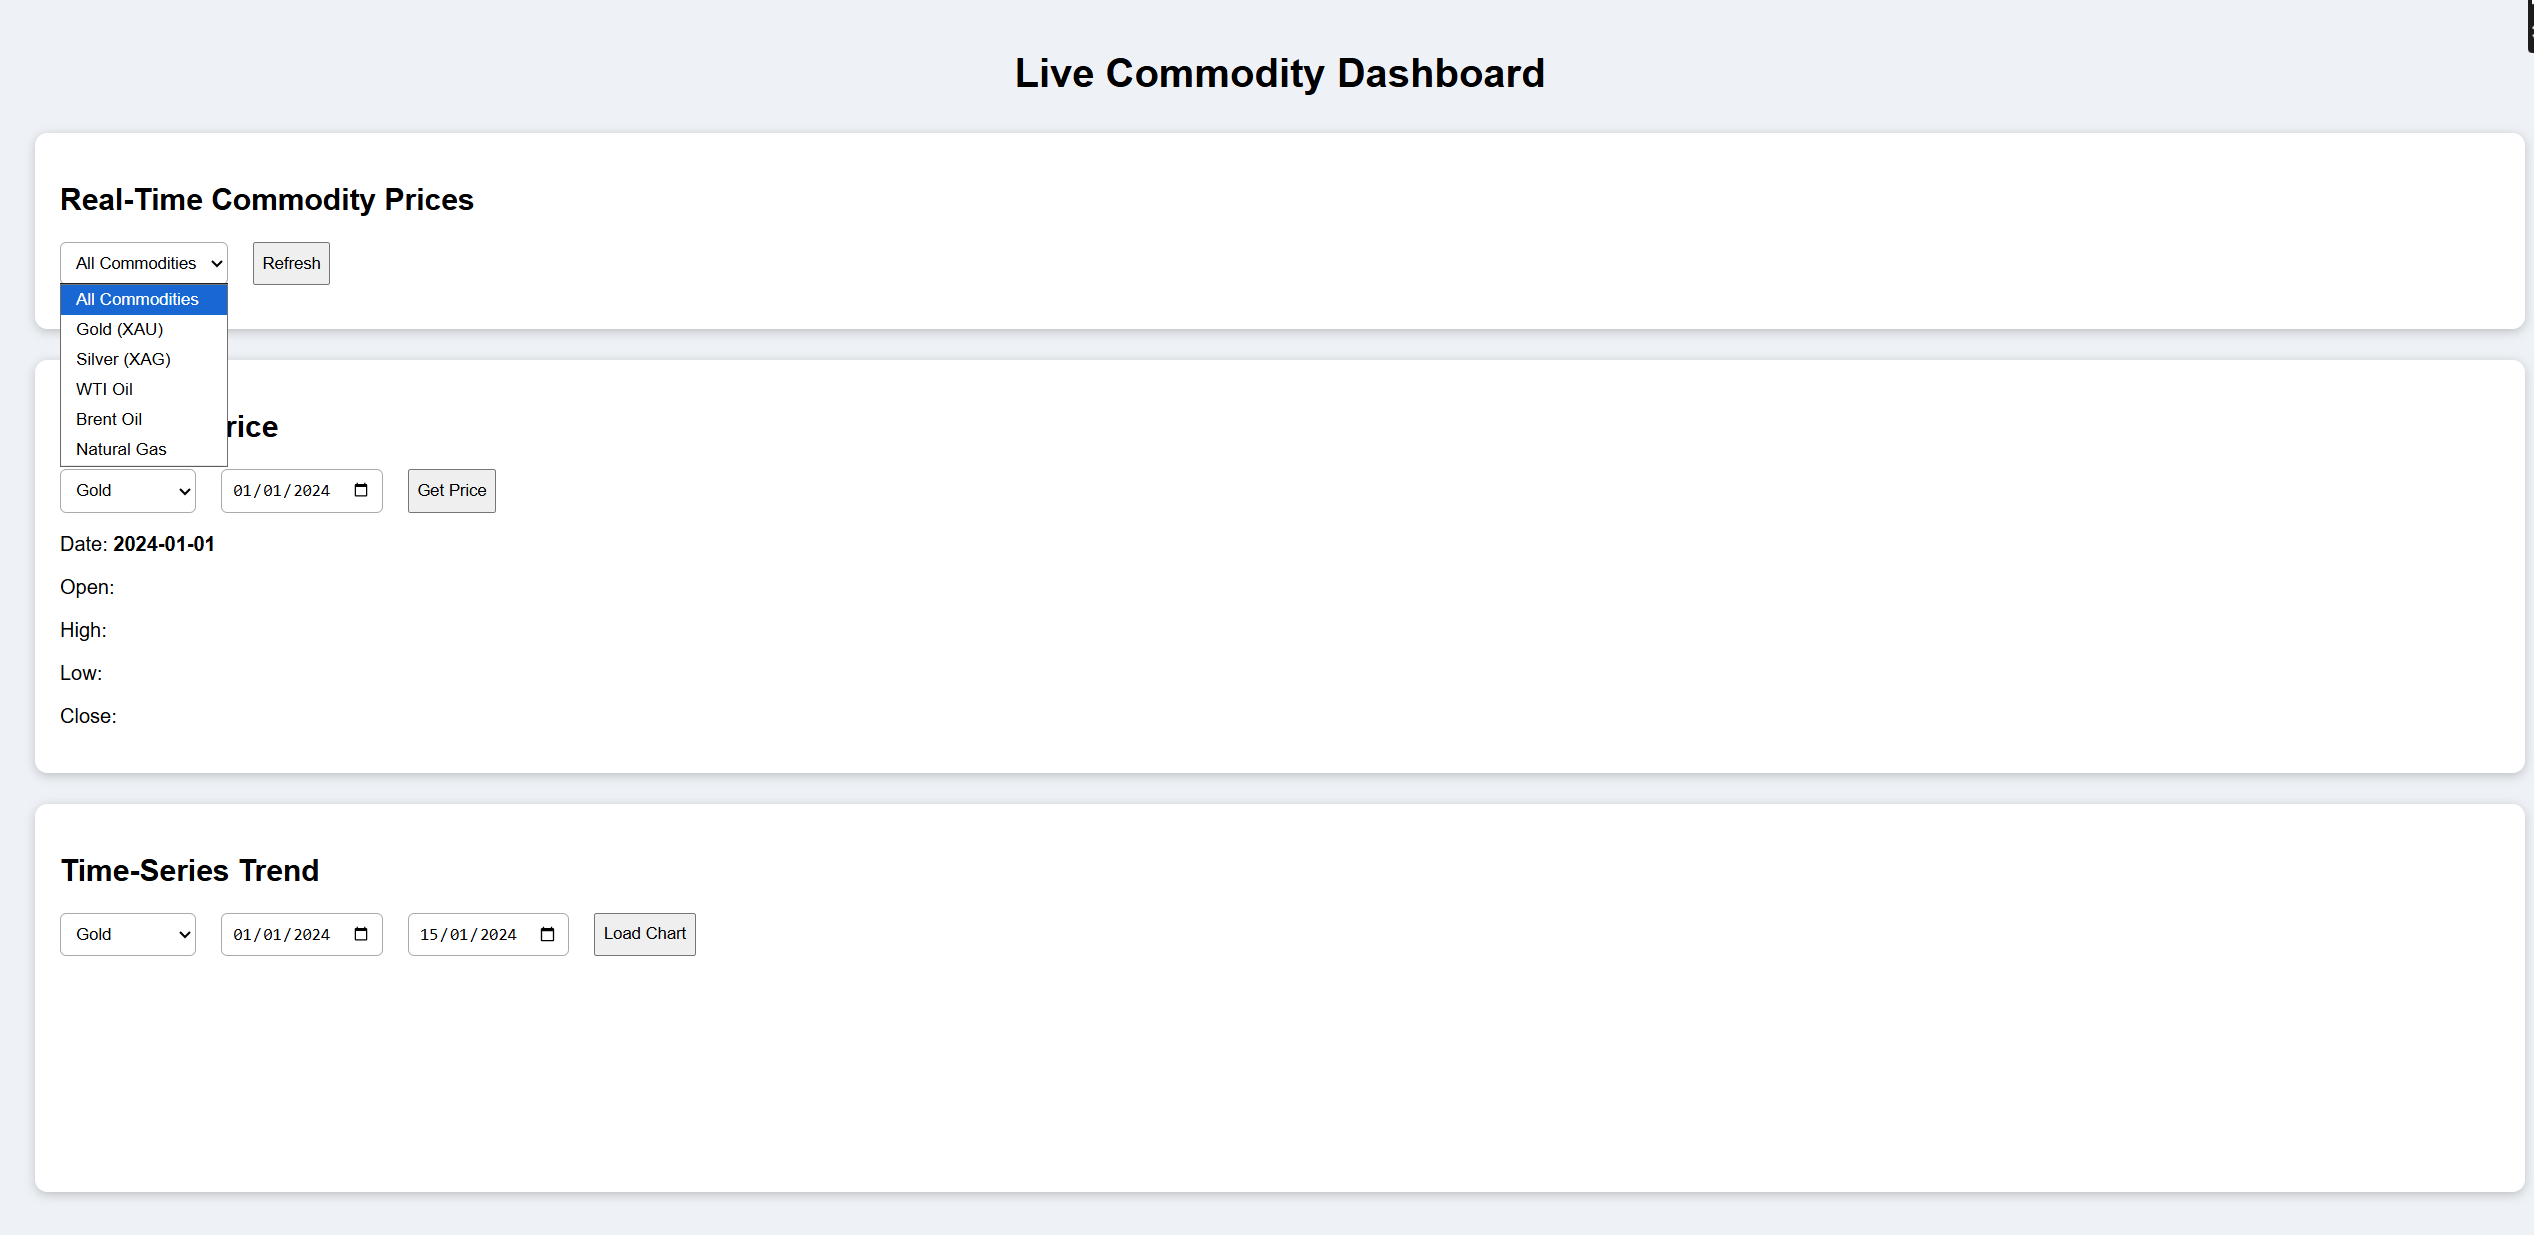
</html>Here is the Output:
Select your preferred currency, such as crude oil, crude palm oil, or natural gas, to know the opening price, closing price or highest price via the powerful JSON API request:
TL;DR
Building a market dashboard is very simple with CommodiyPriceAPI. It gives your real-time and historical prices for the 130 commodities. It includes gold, silver, natural gas, and oil. You can fetch all this data in the JSON format. You can display this data on the dashboard built with HTML, React, Vue, and no-code tools such as Bubble.
You can add historical charts, automatic updates, alerts for enhanced insights according to your needs, and currency conversion. If you are a beginner, start with a few popular commodities and expand them later.
The free commodities API is free to start, and no credit card is required. It offers comprehensive documentation and integrates easily. This saves your time and lets you access real time data and live data without hassle.
It can track trends, including live cattle futures. Because of this, you can make smarter decisions. And if you need help, the customer support team is always available.
Conclusion
If you are creating a new dashboard, and you think it might be difficult. It seems difficult it is very easy. With CommodityPriceAPI, you can easily access the latest gold prices and historical prices, and other commodity prices. It gives you a response in simple and clean JSON format.
First, sign up for CommodityPriceAPI. After signing up for the CommodityPriceAPI, you will get your API key instantly. After that, fetch real-time prices and display them using simple JavaScript and no-code tools. Add charts, filters, and automatic updates to track trends effectively. You can expand functionality with currency conversion, alerts, and comparison tools.
This thing saves your time and avoids errors. It centralizes your information in a single dashboard using the latest endpoint. If you are a trader, developer, or analyst, it supports delivering exchange rates and tracking agricultural products. A dedicated support team helps you stay focused on decisions.
Building a commodity dashboard empowers you to make fast, strategic decisions. It also helps with converting single currencies using midpoint data for accurate insights.
It keeps you ahead in the market with a lowest price advantage. A world-class support team and trusted financial institutions back your workflow while integrating seamlessly with any price API.
FAQs
Is Free Commodities API Is Really Free To Start?
Yes, CommodityPriceAPI offers an unlimited free trial. No credit card is required.
What Data Formats Does The Free Commodities API Return?
It returns JSON. Any programming language can easily work with it.
How Often Does The API Update Prices?
Lite plan: 10-minute updates. Plus/Premium: 60-second updates.
Which Free Commodities Can I Track?
You can track:
- Gold
- Silver
- Oil
- Natural gas
- Metals
- Energy
- Agriculture
- 130+ symbols.
Can I Build A Dashboard Without Coding?
Yes, for its use of no-code tools such as Bubble, Retool, or Glide.
Can I Convert Commodity Prices To EUR, GBP, Or PKR?
Yes, this option is supported on Plus and Premium plans.
How Far Back Does The Historical Data Go?
They give you historical data from the 1990s.
Can I Request Multiple Symbols In One Call?
Yes, the free commodities API tier allows 5 symbols per request.
Will My Dashboard Break If The API Rate Limit Is Exceeded?
You will receive a 429 TOO_MANY_REQUESTS error. Cache data to prevent issues.
Can I Use This API In Commercial Products?
Yes, depending on your subscription plan.